
SLIDE 1
SCOTTSDALE, AZ ACQUISITION DECEMBER 2018
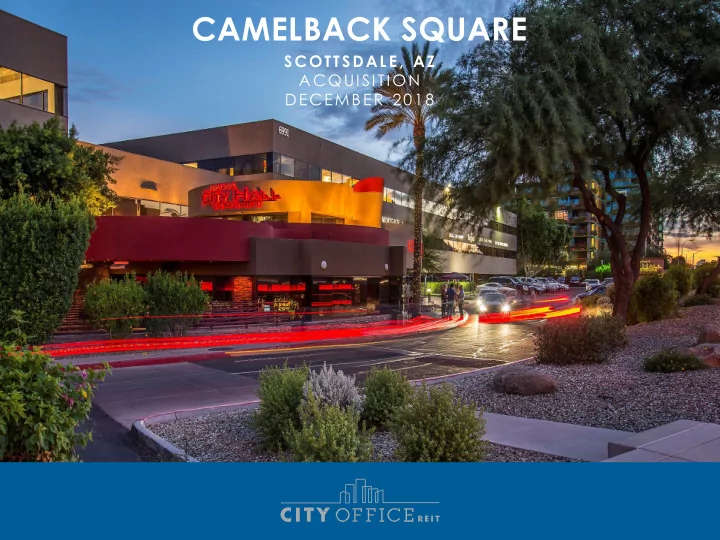
CAMELBACK SQUARE SCOTTSDALE, AZ ACQUISITION DECEMBER 2018 - - PowerPoint PPT Presentation
CAMELBACK SQUARE SCOTTSDALE, AZ ACQUISITION DECEMBER 2018 FORWARD-LOOKING STATEMENTS Certain statements contained in this presentation, including those that express a belief, expectation or intention, as well as those that are not statements
SCOTTSDALE, AZ ACQUISITION DECEMBER 2018
FORWARD-LOOKING STATEMENTS
Certain statements contained in this presentation, including those that express a belief, expectation or intention, as well as those that are not statements of historical fact, are forward-looking statements within the meaning of the federal securities laws and as such are based upon City Office REIT, Inc. (“City Office” or the “Company”) and its current beliefs as to the
will be those anticipated by the Company. Examples of forward-looking statements include projected capital resources, projected profitability and portfolio performance, estimates of market rental rates, projected capital improvements, expected sources of financing, expectations as to the timing of closing of acquisitions, dispositions, or other transactions, the expected operating performance
anticipated near-term or recent acquisitions and descriptions relating to these expectations, including without limitation, the anticipated net operating income yield, expected capitalization rates and
based on management’s beliefs and assumptions made by, and information currently available to, management. When used, the words “anticipate,” “believe,” “expect,” “intend,” “may,” “might,” “plan,” “estimate,” “project,” “should,” “will,” “result” and similar expressions that do not relate solely to historical matters are intended to identify forward-looking
looking statements involve risks and uncertainties (some of which are beyond the Company’s control) and are subject to change based upon various factors, including but not limited to the following risks and uncertainties: changes in the real estate industry and in performance of the financial markets; competition in the leasing market; the Company’s ability to forecast accurately the barriers to entry and competition in the markets in which it operates; the demand for and market acceptance of our properties for rental purposes; the amount and growth of our expenses; tenant financial difficulties and general economic conditions, including interest rates, as well as economic conditions in our geographic markets; defaults or non-renewal of leases; risks associated with joint venture partners; the risks associated with the ownership and development of real property, including risks related to natural disasters; risks associated with property acquisitions, the failure to acquire properties as and when anticipated; the outcome of claims and litigation involving or affecting the Company; our failure to maintain our status as real estate investment trust, or REIT; and other risks and uncertainties detailed in the Company’s news releases and filings with the Securities and Exchange Commission, including but not limited to the Company’s reports on Form 10-K, Form 10-Q and Form 8-K in the Company’s SEC filings. Should one or more of these risks or uncertainties occur, or should underlying assumptions prove incorrect, the Company’s business, financial condition, liquidity, cash flows and results could differ materially from those expressed in any forward- looking statement. While forward-looking statements reflect our good faith beliefs, they are not guarantees of future
We disclaim any obligation to publicly update or revise any forward-looking statement to reflect changes in underlying assumptions or factors, of new information, data or methods, future events or other changes. Use caution in relying on past forward-looking statements, which were based on results and trends at the time they were made, to anticipate future results or trends.
ACQUISITION SUMMARY Camelback Square
❖ Camelback Square is a 173,206 SF building with a “AAA” location in the Oldtown Scottsdale submarket of Phoenix ❖ Adjacent to Scottsdale Fashion Square, one of the highest grossing shopping centers in the country and currently undergoing a $200 million upgrade ❖ Planned renovation to convert traditional office spaces to creative suites, enhance building courtyard and amenities, improve street-front presence and upgrade building systems ❖ 81% occupied at close with in-place office rents approximately 20% below expected post-renovation rents (1) ❖ Expecting significant increase in cash flow through lease up
Key Metrics
Purchase price
Year built / Renovated Occupancy at close (1) Expected cash NOI cap rate Estimated replacement cost
Property size
1
Existing Creative Suite Buildout Tenant Suite Award-Winning Courtyard Amenity Space
(1) Uses 12/31/18 occupancy due to known tenant moveouts immediately post close
1 Circle Point I
PREMIER INTERSECTION AND VISIBILITY IN OLDTOWN SCOTTSDALE
HIGHLY DESIRABLE LOCATION IN DENSE AND WALKABLE MIXED-USE CORE
18.9% 15.3% 3.2% 2.7% 21.7% 9.2% 28.9% 0.0% 20.0% 40.0% 60.0% 80.0% 100.0% Vacant 2019 2020 2021 2022 2023 2024+
Lease Expiration Schedule
as of December 31, 2018
ACQUISITION CHARACTERISTICS
“AAA” Location:
➢
Located in the Oldtown Scottsdale submarket of Phoenix, a dense, mixed-use pocket with a radius of approximately one mile that features world-class amenities in a walkable environment
➢
Oldtown contains over 2 million SF of high-end retail, over 300 restaurants/bars and two luxury condominiums
➢
Mastro’s City Hall, one of the state’s top steakhouses, is a restaurant tenant at the property
➢
Camelback Square’s premium location on Camelback Road and Goldwater Blvd is directly across from Scottsdale Fashion Square,
➢
Oldtown commands among the highest rents in the Phoenix MSA and supply of quality office properties is limited
➢
The submarket has seen an influx of tech and creative tenancy driven by its urban live-work-play environment
Value-Add Business Plan:
➢
Planning over $3 million of up-front capital improvements
➢
Opportunity to add amenities and activate courtyard / common areas to elevate above competition
➢
Improve curb appeal and signage at high-traffic intersection
➢
Future expenditures anticipated to convert traditional
Opportunities to Enhance Cash Flow:
➢
~5.1% capitalization rate on Year 1 projected cash NOI, inclusive
➢
~7%+ yield to cost projected after two-year renovation and lease-up period
➢
Low in-place office rents are approximately 20% below anticipated post-renovation market rental rates
➢
Incredible long term development site with over 1.0 million SF of potential mixed use density
2
10.0% 12.0% 14.0% 16.0% 18.0% $20.00 $22.00 $24.00 $26.00 $28.00 2014 2015 2016 2017 2018
Phoenix Market - Class A/B Direct Office Rental Rates vs Vacancy Rates
Rental Rate (Gross) Vacancy Rate
Strong Phoenix Market Fundamentals:
➢
Phoenix offers a pro-business environment with low operating costs, low regulatory burden and a high-quality, well-educated workforce; unemployment rate of 3.9% as of November 2018 (Bureau of Labor Statistics)
➢
Phoenix ranks fourth in the US for projected office-using employment growth for 2018-2019 (Moody’s Analytics)
➢
Phoenix experienced the second highest office net absorption nationally in 2017, with 2.8 million SF absorbed market-wide (CBRE)
➢
Population of 4.7 million in Phoenix; the population of Arizona grew 1.6% in 2017, ranking top-five nationally (Census Bureau)
➢
Phoenix is home to a growing number of corporate headquarters and the economy continues to diversify into areas such as tech, education and healthcare
MARKET STATISTICS – PHOENIX, AZ
3
Source: CoStar
C I T Y OFFICE REIT, I N C . E: investorrelations@cityofficereit.com | T: 604 806 3366 Suite 2990 500 North Akard Street Dallas , TX 75201 Suite 3210 666 Burrard Street Vancouver, BC V6C 2X8