California Coastal Cleanup Day 1 3/2/16 Coastal Cleanup Day 2015 - - PDF document

california coastal cleanup day
SMART_READER_LITE
LIVE PREVIEW

California Coastal Cleanup Day 1 3/2/16 Coastal Cleanup Day 2015 - - PDF document

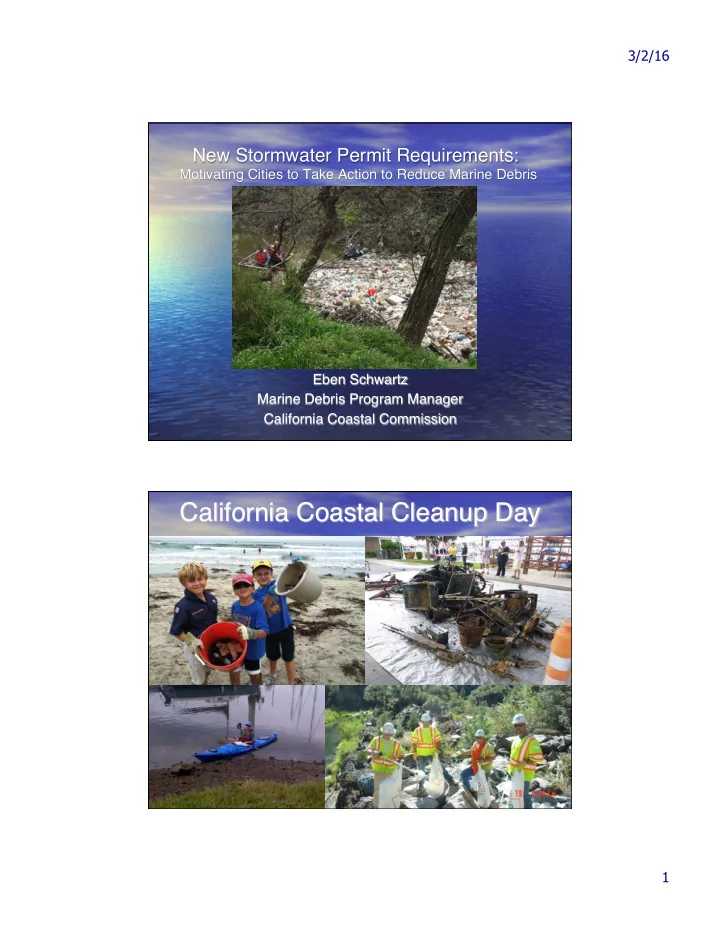
3/2/16 New Stormwater Permit Requirements: Motivating Cities to Take Action to Reduce Marine Debris Eben Schwartz Marine Debris Program Manager California Coastal Commission California Coastal Cleanup Day 1 3/2/16 Coastal Cleanup Day 2015


slide-1
SLIDE 1

3/2/16 1

New Stormwater Permit Requirements:

Motivating Cities to Take Action to Reduce Marine Debris Eben Schwartz Marine Debris Program Manager California Coastal Commission

California Coastal Cleanup Day

slide-2
SLIDE 2

3/2/16 2

  • 68,353

volunteers

  • 1,142,997

pounds of debris removed

  • Over 2,300

miles of shoreline cleaned

Coastal Cleanup Day 2015

Results and Accomplishments

Marine Debris Sources

  • Storm water discharges
  • Combined sewer overflows
  • Beach visitors
  • Ships and other vessels
  • Solid waste disposal and landfills materials such

as garbage and medical waste

  • Offshore oil platforms
  • Industrial activities
  • Illegal dumping or littering
slide-3
SLIDE 3

3/2/16 3

Marine Debris Sources

Approximately 20% from ocean-based sources:

  • Commercial fishing vessels
  • Cargo ships (discharge of containers and garbage)
  • Pleasure cruise ships

Marine Debris Sources

Approximately 80% from land-based sources:

  • Litter (pedestrians, motorists, beach visitors)
  • Industrial discharges (pellets and powders)
  • Garbage management (containers, trucks, landfills)
slide-4
SLIDE 4

3/2/16 4 Los Angeles River Los Angeles River

slide-5
SLIDE 5

3/2/16 5 Ballona Creek

California Coastal Cleanup Day

slide-6
SLIDE 6

3/2/16 6

California Coastal Cleanup Day

CCD 2015

CCD Data 1989-2012

Top Ten 1989-2012 Count Percentage Cigarettes/ Cigarette Filters 6,489,979 39.4% Bags (plastic and paper) 1,801,430 10.9% Food Wrappers/ Containers 1,743,634 10.6% Caps and Lids 1,435,417 8.70% Cups, Plates, Forks, Knives, Spoons 941,094 5.71% Straws, Stirrers 684,445 4.15% Beverage Bottles (glass) 564,135 3.42% Beverage Bottles (plastic) 2 liters or less 428,286 2.60% Beverage Cans 421,646 2.56% Building Materials 308,618 1.87%

slide-7
SLIDE 7

3/2/16 7

Stormwater Regulations

  • 2001 – LA River

TMDL for Trash Established

  • 2003 – Lake Merritt

(Oakland) 303(d) listing

  • 2016 – Statewide

Stormwater Permit for Trash issued

Lake Merritt Drainages

Damon Slough Lake Merritt

slide-8
SLIDE 8

3/2/16 8

Booms & Clean-Ups
 City of Oakland Programs to Improve Watershed Health

  • Captures 2,500 acres
  • Data Since 2003 -

Over 20,000 lbs

  • trash/yr (formerly 50k)
  • Higher collection

rates in rainy season

STORMWATER SEPARATORS

  • Installed ??? Continuous

Deflective Separator (CDS)

  • Total treatment area of ???

acres

  • Considered Total Trash

Capture

  • Currently - 10 Continuous

Deflective Separator (CDS)

  • Two Gross Solids Linear

Removal Device (GSRD)

  • Total treatment area of 925

acres (8% Reduction)

slide-9
SLIDE 9

3/2/16 9

LAKE MERRITT

303(d) Listed - 2003 NOW – Volume Trash halved since 2003/4

Plastic waste generation versus recovery (recycling)- CIWMB

Recovery of Plastics in CA

slide-10
SLIDE 10

3/2/16 10

Local Initiatives Local Initiatives

  • Plastic bag bans or fees since 2006/2007
  • Smoke free beach initiatives being implemented in

cities up and down coast since 2005

  • Polystyrene bans since 2006
  • Stormwater permit regulations and TMDLs in place

and forcing the use of more effective trash collection devices in cities along with local policy innovation

  • “Don’t Trash California” and “Erase the Waste”

education campaigns

slide-11
SLIDE 11

3/2/16 11

CCD Data Up Close

San Francisco Plastic Bag Ban:

2008: 2,212 plastic bags collected in San Francisco County 2012: 2,030 plastic bags collected in San Francisco County 2008: plastic bags account for 9.3% of all debris removed 2012: plastic bags account for 6.2% of all debris removed Correcting for participation: 2008: 2,300 volunteers = .96 plastic bags/volunteer 2012: 3,229 volunteers = .63 plastic bags/volunteer Plastic bag ban resulted in a 34% drop in plastic bag debris

CCD Data Up Close

Ban on Smoking on Los Angeles Beaches:

2009: 6,539 cigarette butts collected on main Santa Monica beach 2012: 1,316 cigarette butts collected on main Santa Monica beach Correcting for participation: 2009: 382 volunteers = 17.12 cigarette butts/volunteer 2012: 189 volunteers = 6.96 cigarette butts/volunteer Smoking ban resulted in a 59% drop in cigarette butt debris – with no significant enforcement effort

slide-12
SLIDE 12

3/2/16 12

slide-13
SLIDE 13

3/2/16 13

Eben ¡Schwartz ¡

Marine ¡Debris ¡Program ¡Manager ¡ Public ¡Education ¡Program ¡ California ¡Coastal ¡Commission ¡ ¡ (415) ¡904-­‑5210 ¡ ¡ eben.schwartz@coastal.ca.gov

Photo ¡Credit: ¡5 ¡Gyres ¡Institute