
SLIDE 1
Calif ifornia Gra rape & Tre ree Fru ruit League To fulfill - - PowerPoint PPT Presentation
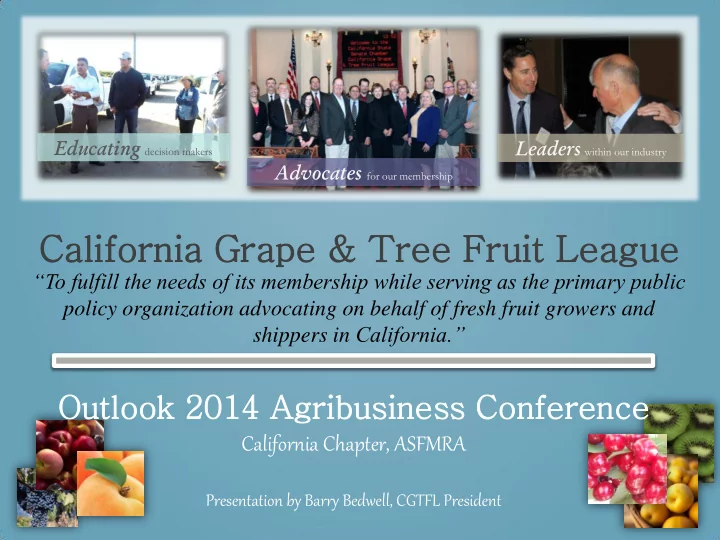
Educating decision makers Leaders within our industry Advocates for our membership Calif ifornia Gra rape & Tre ree Fru ruit League To fulfill the needs of its membership while serving as the primary public policy organization
20,000 40,000 60,000 80,000 100,000 120,000 2006 2007 2008 2009 2010 2011 Est. 2012 Est. 2013
Bearing Acreage
10 20 30 40 50 60 70 2006 2007 2008 2009 2010 2011 Est. 2012 Est. 2013
$500.0 $510.0 $520.0 $530.0 $540.0 $550.0 $560.0 $570.0 $580.0 $590.0 $600.0 2006 2007 2008 2009 2010 2011 Est. 2012 Est. 2013
2 4 6 8 10 12 14 16 2007 2008 2009 2010 2011
2 4 6 8 2007 2008 2009 2010 2011 2012 2013
decrease, although at a slightly slower rate, as growers move primarily to nut and citrus crops.
with current estimates between 200 to 250 as compared to over 700 ten years ago.
decrease with approximately 12 shippers accounting for more than 80% of the market.
but was comparable to 2012 where smaller sizes and lower grades were shipped.
to high forties. This level is seen as an amount that will be effectively marketed.
20,000 40,000 60,000 80,000 100,000 120,000 2006 2007 2008 2009 2010 2011 2012 Bearing Acreage Thompson Seedless Acreage*
20 40 60 80 100 120 140 2006 2007 2008 2009 2010 2011 2012 Est 2013
$0.00 $2.00 $4.00 $6.00 $8.00 $10.00 $12.00 $14.00 $16.00 $18.00 2006 2007 2008 2009 2010 2011 2012 Est. 2013
$0.0 $0.2 $0.4 $0.6 $0.8 $1.0 $1.2 $1.4 $1.6 $1.8 2005 2006 2007 2008 2009 2010 2011 2012 Est. 2013
5 10 15 20 25 30 35 40 2006 2007 2008 2009 2010 2011 2012 Est. 2013
Excludes Canada
2 4 6 8 2009 2010 2011 2012
Chile 65% Mexico 26% Peru 7% Brazil 1% Other 1%
Variety 2012 1 Crimson Seedless 17,865,835 2 Flame Seedless 14,202,971 3 Red Globe 11,126, 289 4 Scarlet Royal 8,672,565 5 Thompson Seedless 7,363,707 6 Autumn King 6,959,913 7 Sugraone 5,887,121 8 Autumn Royal 5,229,995 9 Princess 4,845,529 10 Blanc Seedless 3,339,711 11 90-3618 1,843,146 12 C51-63 1,760,476 13 Summer Royal 1,324,911 14 Sugrathirteen 1,278,836 15 Sheegene-4 967,607
– The continued costs of compliance.
– The need to be commodity specific and risk
– Increasing costs due to trial attorney’s and
– Who will fairly pay for the cleanup?
–
The need for resources. HLB as an example.
–
The incremental impact of minimum wage increases on the price of food.
–
A great example of unintended consequences.
–
Will the drought cause production and price fluctuations? The potential for groundwater
– The role of Governor Brown.
– Board and General Counsel.
– Legislative progress over the last forty years and the catch 22
– The need for a genuine voice for agricultural employees.
– SB 126 implementation near the top of list of
– Authored by Senate President Pro Tem
– First rejected by UFW who preferred Card
– Where will the bar be set on employer
–
Authored by Senator Pro-Tem Steinberg
–
Would create a pathway to perpetual mandatory mediation (where currently only the initial contract is so subject). Could create a scenario whereby current employees would never cast a secret ballot.
–
Provides that an action to enforce an order of the ALRB with reference to the mandatory mediation decision of the Board may be filed within 60 days whether or not the
–
Would also increase the evidentiary threshold for the court to grant a stay of the Board's order and would require the court to make written findings supporting any order granting a stay of the order during the pendency of the appeal.
– A 2012 survey by the California Farm Bureau found that 71 percent of tree
– In 2008, Texas A&M reported that 77 percent of vegetable farmers reported
– The problem exists for all facets of agriculture, beyond just fruits, vegetables
– The shortage of farm workers has several causes, including the reverse
–
Agricultural Coalition For Immigration Reform (ACIR)
–
National Council of Agricultural Employers (ACAE)
–
Agricultural Workforce Coalition (AWC) Partnership For A New American Economy (PNAE)
–
United Farm Workers (UFW)
–
To be eligible for a green card the workers must have:
for at least 100 work days per year during the upcoming 8-year period; or
employment for at least 150 workdays per year during the upcoming five-year period.
–
Cap, Wages, Housing, Transportation, Recruitment, Attestation , Dispute Resolution, Equal Treatment
–
In 2012, Republicans were expected to maintain majority in House, but lost some
Republican as of 33 seats up 23 are D and 10
Republicans.
– No special path to citizenship – Background checks – Pay fine and back taxes – Learn English and civics – No access to public assistance
Barry Bedwell (559) 226-6330 – bbedwell@cgtfl.com