
SLIDE 1
Third Party Evaluation and Impact Assessment by TDSC-IIT Bombay
- f Jalyukt Shivar Abhiyan in Palghar District
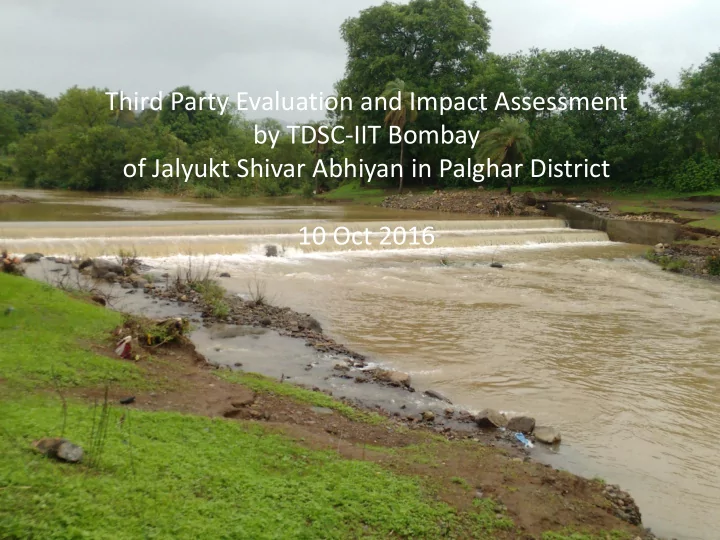
by TDSC-IIT Bombay of Jalyukt Shivar Abhiyan in Palghar District 10 - - PowerPoint PPT Presentation
Third Party Evaluation and Impact Assessment by TDSC-IIT Bombay of Jalyukt Shivar Abhiyan in Palghar District 10 Oct 2016 Contents Key Objectives of JSA Methodology as per GR Assessment process Assessment results (tabulation, Ok
– All 50 villages in Phase 1 – Measurements and Engineering Assessment, Location, Photographs, Rapid assessment of JSA village plan, GIS map
– Detailed study and evaluation of all stages of JSA of selected villages
– Technical evaluation report for List A – Detailed overall planning process evaluation – Success indicators, replicable assessment methodology – Impact assessment report, recommendations – Support for tools for Monitoring, GIS, data sharing
Structure Parameters CNB Constructed base leakage, side leakage, blasting, anchoring, reinforced or not, main structure condition, side wall condition, siltation, deterioration, utilization, wells nearby Under Construction Reinforced or not, cover OK or not, blasting, vibration, anchoring, downstream slope, shuttering quality, utilization, wells nearby Repair Work repair method, leakage base, leakage sides, blasting, anchoring, reinforced, main structure condition, side wall condition, siltation, deterioration, utilization, wells nearby Ponds Side wall condition, siltation, soil discarded, utilization, nearby wells
Department Proposed in 2015-16 Completed works till May 2016 Assessed
Unit Rs.(lakh) Unit Rs.(lakh) Unit
Agriculture
1202 2888.61 534 665.99 492 593.43
Forest department
526 766.33 467 446.61 393 421.19
Minor Irrigation (ZP)
85 1042.61 45 566.06 34 335.47
Minor Irrigation (WC)
12 436.23 5 60.00 8 247.50
GSDA
7 30.10 7 20.98 3 11.98
Rural Water Supply
46 255.29 0.00 0.00
Social Forest
25 58.31 0.00 0.00
Wildlife - Thane
3 67.47 0.00 0.00
Total 1906 5544.95 1058 1759.64 930 1609.57
2888.61 766.33 1042.61 436.23 30.10 255.29 58.31 67.47
Agriculture Forest department Minor Irrigation (ZP) Minor Irrigation (WC) GSDA Rural Water Supply Social Forest Wildlife - Thane
593.43 421.19 335.47 247.50 11.98 0.00 0.00 0.00
Agriculture Forest department Minor Irrigation (ZP) Minor Irrigation (WC) GSDA Rural Water Supply Social Forest Wildlife - Thane
Work Agriculture Forest MI ZP Total CNB repair 1 1 ENB 1/1 2 LBS 1 2 3 Horticulture 1 1 Pukka Bund 1 1/1 3 Pukka Bund repair 1/1 2 Forest Bund desilting 3 3 Forest Pond 1 1 Farm Pond 9/1 10 CCT 1 1 CCT Deepening 6 6 Total 15 14 4 33 % of Total assessed works 3% 3.5% 11.5% 3.5%
West wing – RED, East wing - GREEN
strengthening works etc. are absent
less area under irrigation, iii) forest cover, iv) demand for labour work
status
repair, PWS repair, new PWS etc.
This will help in tackling drinking water scarcity
villages
significant forest cover
This will help in increasing stream flows, reducing soil erosion
employment under NREGA
This will help in targeting beneficiaries correctly
This will help in creating employment and reducing migration
Big boulders in ongoing CNB in Raitale (Jawhar)
and slope
Forest pond – KHARSHET (PALGHAR)
CCT Deepening( Dolharpada-Forest) CCT was done in a flat area, where its purpose is wasted. Reason provided for doing so was that the mud excavated will be used for nursery's plantation
Galtare farm pond gat no 220: soil eroded from the wall, hard strata
The hole was later patched by the department Concrete has come out and reinforcement is visible
Water and Development
Finally Milind Sohoni
www.cse.iitb.ac.in/∼sohoni email: sohoni@cse.iitb.ac.in
November 9, 2017 1 / 31
The basic movement of water
source: USGS.
November 9, 2017 2 / 31
The basic stocks and flows
Atmospheric Water Sub−surface Water Groundwater Surface Water Ocean−water
Runoff Baseflow Recharge Extraction Precipitation Transpiration Evapo−
Air Moisture: Clouds end in the Troposphere (about 35,000 ft). Surface: Rivers, streams and
reservoirs.
◮ Subsurface: Soil Moisture.
Groundwater: under the water table.
November 9, 2017 3 / 31
Measuring Stream-flows
For larger streams Use a stick-mounted flow-meter. Select a stream cross-section. Follow a schedule
at various depths and points on the cross-section. Use formula to compute flow.
November 9, 2017 4 / 31
Deficit
November 9, 2017 5 / 31
The regional water system
Attributes of Water Users: households for domestic consumption, farmers for agriculture, industries as a raw material for their processes. By nature: geographic resource, utilization depends on regional, scientific and technological issues. Quality and Quantity. Two largely scientific attributes of water. Source, Transmission and Destination. Devices of extraction, transmission and delivery to points of use. Treatment
Demand and Supply. Socio-economic attributes of actual quantity and quality of water demanded, Seasonality, economic and technical efficiency of use, regulations on pollution. The supply side: ownership of resources, planning and regulation.
November 9, 2017 6 / 31
A Region as an example
November 9, 2017 7 / 31
Details
Dimbhe: Pune district, nestled between two high ridges on its north as well as the south. Dimbhe reservoir covers an area of 17 sq. km. Capacity of 350 million cubic meters (MCM). Catchment of 400 sq. km., and includes the Bhimashankar temple area and sanctuary. 50 tribal hamlets with a population of about 30,000. The river, called Ghod, flows out of the reservoir and makes its way to join Bhima river. The towns of Ghodegaon (pop. 8000) and Manchar (pop. 15000) lie on this river. 10 thousand hectares of irrigated lands and an equal area of partially irrigated or rain-fed lands. Crops include Sugarcane, Maize, Rice, Grapes and other horticultural crops.
November 9, 2017 8 / 31
Close-up
November 9, 2017 9 / 31
Downnstream System
Close-up of the reservoir, the dam and the gates discharging water. Left-bank canal and the spur of its its bifurcation into a right-bank canal, which actually crosses the river. Most of the farmers who irrigate their lands do it by lift irrigation schemes from KT weirs. A substantial component of the ground-water is recharged by the reservoir and the river and canal flows. Some farmers are indirect beneficiaries of the irrigation project.
November 9, 2017 10 / 31
Downstream
November 9, 2017 11 / 31
Ghodegaon
November 9, 2017 12 / 31
Discharge and KT Weir
November 9, 2017 13 / 31
Salient Features
November 9, 2017 14 / 31
Budget
November 9, 2017 15 / 31
Systems
The Irrigation System. State agency which maintains the dam, reservoir and KT weirs. It operates the gates and the canals so that water is made available to the agriculture and the domestic system periodically. Fees from farmers and from domestic users. The Agricultural System. Private farmers need for water. Lift irrigation systems which are collectively owned and maintained. Partially irrigated and rain-fed farms. Crop-water demand, source and application of water. Energy costs for lift irrigation, extraction from wells and bore-wells. Key variable:soil moisture. The Domestic Use system. Rural and urban consumer.Key assets:engineering at the source, the transmission, the distribution and discharge. Key variables
◮ (i) ownership of the system, (ii) the level of service, (iii)
financial and technical viability (iv) fees and cess paid to the irrigation system, (v) fees collected from users.
November 9, 2017 16 / 31
The Physical System
This is largely the water in the system which must flow according to physical laws and which must transit from one state to another and
1
ground-water flow, and (iii) conservation of mass.
2
precipitation, absorption of water by plants, evapo-transpiration and so on.
3
climatic data.
4
Parameters and boundary conditions. Parameters forced by the human systems. This includes location of wells and their extraction, crop water demand and its location, specification of engineered assets such as canals and channels and so on.
November 9, 2017 17 / 31
The System
Community Surface Water Infrastructure Irrigation Wells Ground−Water AtmosphericW Agri−market Farmers Fields
Figure: The Ghodegaon Cycle
November 9, 2017 18 / 31
Tables
A pictorial representation of the system is shown in Fig. 1.The boxes show two different types of entities: various scientific entities which are used in the laws and models of the physical system, and various interacting social associations/structures, as given in the table below: Agent/Structure Type Irrigation State Farmers Civil Society Community Community Agri-market Market Infrastructure, Wells, Fields Asset Surface water, Ground-water, Atmospheric water Stocks
November 9, 2017 19 / 31
Objectives
Multiple inter-linked systems-irrigation, agriculture, drinking water, down-stream systems. The Planning Approach Supply ⇔ Allocation ⇔ Demand Principles sustainability, efficiency and equity choice of crops, a choice of irrigation techniques, tariffs so that the irrgation system is paid for and yet the farmer finds a market for his/her crops. surface and groundwater do not get polluted adequate water for domestic use and also for people downstream
November 9, 2017 20 / 31
The Design Cycle
Development Bio-physical Designs and Outcomes ⇒ Outcomes ⇒ Plans Development Outcomes Socio-economic, normative concerns such as equity, access. More cropping area. More certain and more secure water. Good quality drinking water. easy to maintain systems. Bio-physical Outcomes Science and Technology Choice, Sustainability. Water requirements, norms. Specific flows and stcoks. Distribution Policy. Design and Plans Interventions, Efficiency. Overall plans. Major and minor structures.
November 9, 2017 21 / 31
D a r e g a o n D a r e g a o n
83 90 126 39 58 68 66 53 85 139 74 4 69 26 2 97 59 70 24 1 27 99 146 43 100 60 44 65 136 177 52 81 111 29 50 180 17 89 87 164 73 151 75 77 57 157 56 104 131 40 152 164 119 55 96 116 117 41 35 162 187 185 143 174 37 163 36 19 155 183 20 34 106 173 175 105 47 48 49 173 46 23 32 31 33 30 67 162 179 172 125 64 72 181 129 63 142 71 62 127 148 54 178 120 124 21 76 128 78 141 138 150 161 84 107 135 42 149 160 93 165 156 171 91 167 118 145 144 79 88 173 92 131 132 109 51 170 114 186 153 61 188 98 159 94 137 134 22 168 166 101 16 121 123 103 182 122 9 112 5 133 179 15 18 113 169 115 158 7 12 162 38 29 140 3 13 108 130 165 158 184 28 147 75°29'0"E 75°29'0"E 75°28'30"E 75°28'30"E 75°28'0"E 75°28'0"E 75°27'30"E 75°27'30"E 75°27'0"E 75°27'0"E 75°26'30"E 75°26'30"E 75°26'0"E 75°26'0"E 20°5'30"N 20°5'30"N 20°5'0"N 20°5'0"N 20°4'30"N 20°4'30"N 20°4'0"N 20°4'0"N 20°3'30"N 20°3'30"N PREPARED FOR:: Vasundhara Watershed Development Agency, Maharashtra, Pune-1 And Director of Soil and Water Conservation Maharashtra, Pune-1 Sillod Kannad Vaijapur Paithan GangapurAurangabad Fulambari Soegaon Khuldabad Soegaon Part of Jalna District Part of Vaijapur Bid Pune Nashik Solapur Satara Jalgaon Thane Yavatmal Gadchiroli Jalna Latur Amravati Sangli Nagpur Nanded Dhule Buldana Chandrapur Ratnagiri Raigarh Kolhapur Gondiya Osmanabad Nandurbar Sindhudurg Bhandara Legend Linaments/Dyke Contour 5 Meter Watershed Boundary Survey/Gat No. Boundary Village Boundary Drainage Line Treatment Gully Plug or LBS Earthen Nalla Bund/ Gabian Bandhara Nala Desilting/C.N.B./K.T. Area Treatment Dry land Agriculture/Contour Bunding/ Farmpond Afforestation/ Dry Land Horticulture/Plantation CCT/Deep CCT/WAT/Forest Pond Compartment Bunding/Graded Bunding/Fram Pond/Well Recharge River/ Waterbody Village Area Page Size:A1JALYUKT SHIVAR ABHIYAN (2017-18)
In Map Show Existing Activities with Red Colour and Proposed Activities with Green Colour (For Official Use Only)November 9, 2017 22 / 31
Variable Access to Water
November 9, 2017 23 / 31
Interventions and their influence
November 9, 2017 24 / 31
The Development Question
How did it come to be so? What is the present? How do we get out? (i) Poor knowledge formation. In elementary education, higher and professional education, practices, absence of scientific methodology, in adequate comprehension of society, inadequate understanding of the vicinity. (ii) Information asymmetry. Transaction between informationally un-equals. In the market, in the court, at the gram sabha. RTI, IT seen as antidotes. (iii) Malfunctioning institutions. Insufficient capital, poor and
assessments, loss of trust. (iv) Collective Failure. Historical. Inability to act for collective good. Loss of culture. Divergent agenda. (v) Resource constraints. Actual physical limits. Poor efficiency and poor indigenous technology.
November 9, 2017 25 / 31
Mess Food
Agent Gives Gets Agent Based On Students Elect Serves Secretary Quality Students Pay Facility Manager Bill Secretary Supervises Manager Competence Manager Supervises Worker Output Manager Pays Supplies Supplier Quality Manager Pays Work Workers Hours Institute Pays Workers Attendance Workers Serve Students Food Secretary Informs Institute QoS
November 9, 2017 26 / 31
An Example
Cotton farmer from Vidarbha where farmer suicides have taken a great toll. Poor knowledge formation, develop good practices. ill-informed in buying inputs information asymmetry: poor margins at the mandi, too little water for him to water his crop
November 9, 2017 27 / 31
More examples
A missing bridge to cross a river for school-going children. This missing asset may be at once a resource constraint, i.e., the inability of the government to build the bridge or also a knowledge weakness, i.e., an inability of the government to measure the loss of social value and see whether it compensates for the cost of the bridge, or finally, the institutional failure of the government to enforce its own directives to lower level staff. tragedy of the commons which is variation of a failure to act
Karjat taluka which had a community water supply scheme which gives 400 liters per day per household. Only when all pay, is the scheme financially sustainable. However, a few richer households want a higher quantum of water than can be met by the scheme. Since this demand is unmet, these households may dig a bore-well to meet their demand and thus opt out of the public scheme.
November 9, 2017 28 / 31
The Role of Science and technology
Methods and Outcomes. The law vs. how to arrive at it. Gadgets and Processes. The device vs. where it embeds. The S&T practices within a society are important determinants of its development Adaptation and innovation to changing situations. more efficient use of resources, production. Public comprehension. Better informed decisions. Better design of institutions.
November 9, 2017 29 / 31
The Development Professional
A cultural or civil-society agent. Trust and prestige, role-model, thought leadership in the public sphere. Core values but otherwise neutral. Methodological and process-driven contributions.
Society
Identify Problem Deploy Synthesize Analyse Civil Econo. Maths. IT Domain Creative Skills Societal Skills Knowledge
The Development Professional
Figure: Activities of the Development Professional
November 9, 2017 30 / 31
The Development Professional
A cultural or civil-society agent. Trust and prestige, role-model, thought leadership in the public sphere. Core values but otherwise neutral. Methodological and process-driven contributions. (i) identify stake-holders and measure the key attributes of the problem. (ii) identify the key agents and processes. (iii) form an inter-disciplinary historical or regional narrative. (iv) decompose the problem into disciplinary sub-problems. (v) solve of the subproblems and synthesis. (vi) deliver value to the stake-holders and charge fees.
November 9, 2017 31 / 31
Thanks
November 9, 2017 32 / 31