SLIDE 1
By Biswajit Mondal
27-06-2015 DOI: 10.1021/jacs.5b04210
SLIDE 2
Background:
From Aggregation-Induced Emission of Au(I)−Thiolate Complexes to Ultrabright Au(0)@Au(I)−Thiolate Core−Shell Nanoclusters
Luo et al. J. Am. Chem. Soc. 2012, 134, 666−16670.
SLIDE 3 Introduction:
- Semiconductor quantum dots and the organic dye molecule have received
attention in technological application as diode display and luminescent sensor.
- Xie and his co-worker have synthesized Au22(SG)18 and shown that
luminescence quantum yield of 8% and the origin of luminescence in them still remain unclear.
- Luminescence of Au(l)-thiolate complex depends on the solvent-induced and
the cation-induced aggregation and this enhanced luminescence is called aggregation-induced emission(AIE).
- In this report they present a novel strategy to dramatically enhance the
luminescence efficient of gold cluster based on the core-shell structure of Au22(SG)18. They have probed the origin of the luminescence in Au22(SG)18.
- Luminescence arises from the ligand to metal-metal charge transfer state of
gold shell.
SLIDE 4
In this paper: In this paper they have synthesized Au22(SG)18 cluster and they have done the temperature dependent and time resolved PL measurement of Au22(SG)18 cluster and the TOA-Au22.
SLIDE 5
Result and discussion:
Figure 1. (a) ESI mass spectrum of Au22(SG)18 clusters obtained from the synthesis. The inset shows a comparison between the experimental data (gray line) and the calculated isotope pattern (black line) of [Au22(SG)18-5H]5−. (b) Absorption spectrum and (c) excitation and emission spectra of Au22(SG)18 in water.
SLIDE 6
Figure 2. (a) Temperature-dependent photoluminescence spectra of Au22(SG)18 clusters at different temperatures. Inset shows the plot of PL maximum (black circles) and normalized PL intensity (red circles) as a function of temperature. (b) PL decay traces of Au22(SG)18 clusters as a function of temperature. Inset shows the average lifetime as a function of temperature.
SLIDE 7
Figure 3. Schematic diagram showing the excited state relaxation dynamics in Au22(SG)18 clusters in water. T1 and T2 represent LMMCT states of the gold shell. T2 states are destabilized by freezing or rigidifying the gold shell.
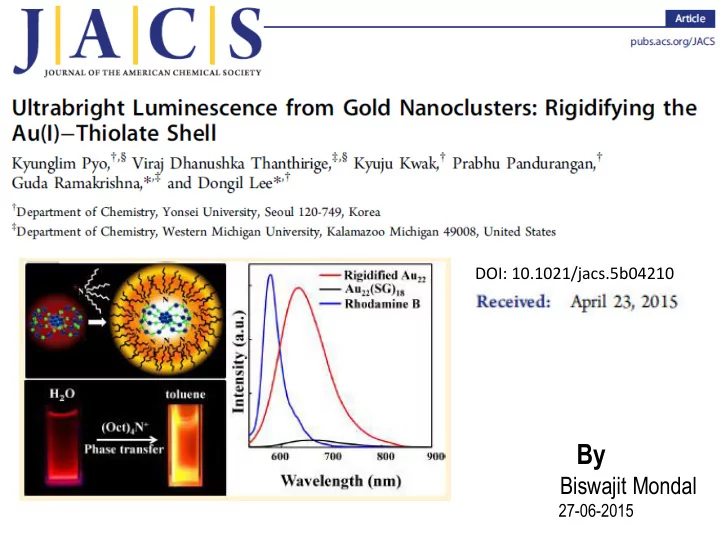
SLIDE 8 Figure 4. (a) Schematic of binding TOA to Au22(SG)18 clusters (Au, blue; S, green), (b) digital photograph of Au22(SG)18 in water and TOA-Au22 clusters in toluene under long-wavelength UV lamp irradiation (365 nm), and (c) luminescence spectra of Au22(SG)18 in water and TOA-Au22 in
- toluene. Also, shown in the graph is the fluorescence spectrum of Rhodamine B (RhB, QY =
31%) with the same optical density.
SLIDE 9
Figure 5. (a) Luminescence spectra of Au22(SG)18 paired with quaternary ammonium cations with different chain length: Au22(SG)18 in water (black) and CTA- (pink), TMA- (blue), TOA- (red), and TDA-paired (green) Au22 clusters in toluene. All cluster solutions have the same absorbance (0.025) at 514 nm and are excited at 514 nm. (b) Luminescence of TOA-Au22 clusters in various solvents with different dielectric constants: toluene (ε = 2.38), dichloromethane (ε = 8.93), ethanol (ε = 24.5), methanol (ε = 32.7), and acetonitrile (ε = 37.5) and Au22(SG)18 in water (ε = 80).
SLIDE 10 Conclusion:
- They have shown that it is possible to achieve luminescence
quantum yield greater than 60% by rigidifying the gold shell by lowering the medium temperature or binding with bulky group.
- Aurophilic effect in the gold shell and the LMMCT relaxation is
important for the higher luminescence.
SLIDE 11 Future direction:
- Using this concept we can increase the luminescence of the gold cluster. And
this highly luminescence cluster can be used as biomedical imaging, display
- application. This cluster also can be used for the detection of protein.
SLIDE 12
Thank you