
SLIDE 1
Business Intelligence for Microsoft Dynamics
Business Intelligence for Microsoft Dynamics > 21 languages - - PowerPoint PPT Presentation
Business Intelligence for Microsoft Dynamics > 21 languages > 50 countries > 150 partners > 700 customers TRUSTED AROUND THE GLOBE ALL INDUSTRIES Add content & performance Content Flexibility + Additional areas
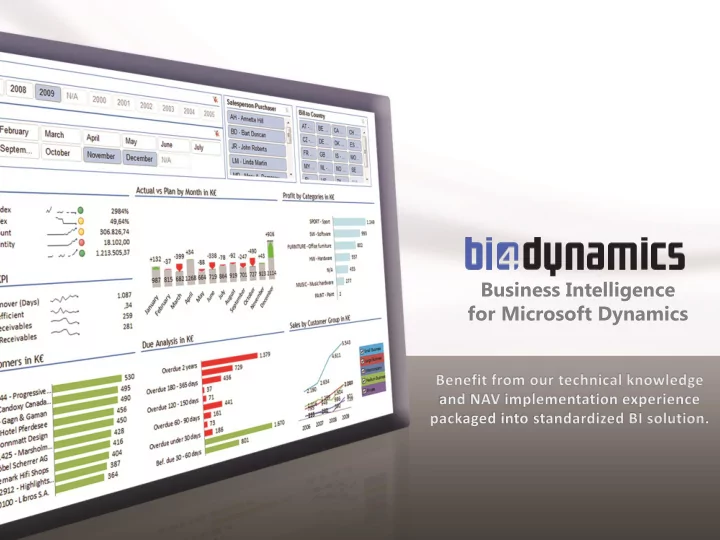
Business Intelligence for Microsoft Dynamics
> 21 languages > 50 countries > 150 partners > 700 customers
Add content & performance
(Item, Resource, GL Account, FA)
analysis
numbers
money is“
analysis
habits
who you will work with in the future
financial advisors
financial area
such a financial solution
vendor or internal IT to support
attribute
keep everything
consumption and output
using ERP solutions
already know and numbers behind
(exceptions)
structure of manufacturing master data
employee
who is not
get rid of lazy underperformers
Add content & performance
EXEC dbo.DropObject 'dim.ItemView', 'V' GO CREATE VIEW dim.ItemView AS SELECT a.No, Type = 2, -- Item Description = ISNULL(NULLIF(a.Description, ''), 'N/A'), BaseUnitofMeasure = ISNULL(NULLIF(a.BaseUnitofMeasure, ''), 'N/A'), BaseUnitOfMeasureDesc = ISNULL(NULLIF(b.Description, ''), 'N/A'), BaseUnitOfMeasureCodeDesc = ISNULL(NULLIF(a.BaseUnitofMeasure, ''), 'N/A') + ISNULL(' - ' + NULLIF(b.Description, ''), ''), InventoryPostingGroup = ISNULL(NULLIF(a.InventoryPostingGroup, ''), 'N/A'), InventoryPostingGroupDesc = ISNULL(NULLIF(c.Description, ''), 'N/A'), InventoryPostingGroupCodeDesc = ISNULL(NULLIF(a.InventoryPostingGroup, ''),'N/A') + ISNULL(' - ' + NULLIF(c.Description, ''), ''), ItemDiscGroup = ISNULL(NULLIF(a.ItemDiscGroup, ''), 'N/A'), ItemDiscGroupDesc = ISNULL(NULLIF(d.Description, ''), 'N/A'), ItemDiscGroupCodeDesc = ISNULL(NULLIF(a.ItemDiscGroup, ''), 'N/A') + ISNULL(' - ' + NULLIF(d.Description, ''), ''), VendorNo = ISNULL(NULLIF(a.VendorNo, ''), 'N/A'),
General ledger 15‘ Sales (orders) 1h Receivables 1 day Manufacturing 2h
Source #1
(v2009,v2012) Source #2
(v3,v4 …)
Copy
Update daily
200 400 600 800 1 000 1 200 1 400 1 600 1 800 2 000 500 000 1 000 000 1 500 000 2 000 000 2 500 000 3 000 000 3 500 000
4 000 000 4 500 000
Stock Value Stock Rotation (Days)