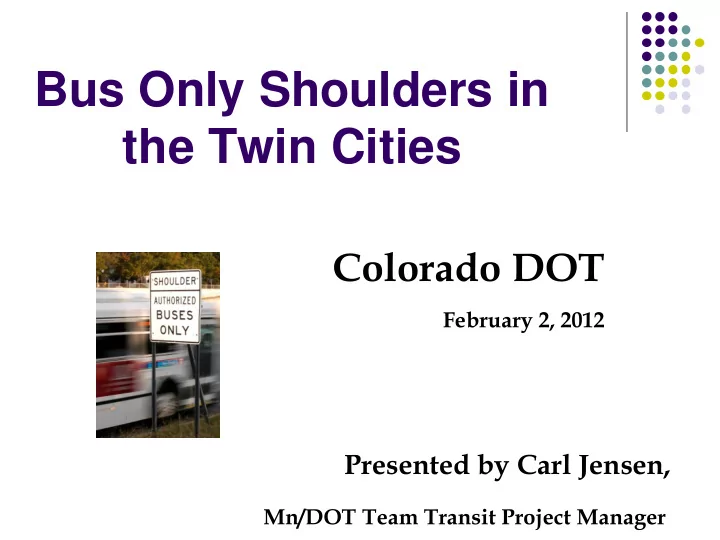

Bus Only Shoulders in the Twin Cities Colorado DOT February 2, 2012 Presented by Carl Jensen, Mn/DOT Team Transit Project Manager
Outline Background History Safety Law Enforcement Benefits Design Maintenance Funding Driver Training
BACKGROUND Increasing congestion in the Twin Cities Not possible to “build” out of congestion Need for innovative ways to increase capacity Use existing infrastructure Team Transit a partnership of Mn/DOT, Metro Transit, Cites, Counties and other and other stakeholders.
HISTORY OF BOSs First pilot project on Highway 252 (arterial) First use of freeway shoulder during spring flood of 1993 Governor Carlson called emergency meeting to find a solution Authority to Law
SAFETY Safety Statistics by Mn/DOT In Jan 2001 Mn/DOT In 2009, 17 years of conducted crash operation, over 290 analysis* on the miles of BOS, and only existing 175 miles of one injury crash. BOS. Over nine years there were only 20 crashes involving a bus, and each crash involved property damage only. *crashes recorded by State Patrol
SAFETY Safety Statistics by Mn/DOT update 2011 Mn/DOT updated the crash findings in Mid 2011, records from 2007 to 2009 on the existing miles of BOS, which is now 296 miles. There has been 1 additional injury accident, the driver of the SOV was at fault. *crashes recorded by State Patrol
Safety Statistics by Metro Transit for 2003 1718 express trips per day can use shoulders Collisions 21 36,500 express trips Sideswipes per month /mirror hits 19 Monthly express trips Total Losses $7,680 per collision =13,908 Largest Loss $3000 Single trip collision probability: Once every 27.3 years.
Why is it safe? Operational Guidelines: Low speeds, <35 mph Accountable, Speeds not >15 mph Professional Drivers faster than adjacent BOS use not required traffic Must yield to any vehicle Visible, big bus entering, merging within, High vantage point for or exiting through the shoulder bus drivers Must re-enter mainline Small number of where shoulder is vehicles, large number obstructed (vehicle, debris, incident, etc.) of people moved
BOS into Law Uniform Vehicle Code prohibits driving on shoulders Operational Guidelines & Alternate Standard Originally, buses operated on the shoulder under the authority of the Commissioner of Transportation (pilot projects) Passage of a BOS law in codified regulations and standards and made it possible for law enforcement to issue tickets for improper use Charter buses
Enforcement Tickets not typically to bus drivers Garage supervisors go out and radar “clock” buses and fix any problems Gradation of realization (started without public awareness campaigns) Copycat fear not realized “Jealous Motorist” occasional problem
Bus-Only Shoulder Benefits Move the most people through congestion on Travel time savings existing infrastructure =advantage for rider AND $$ for transit provider Reliability , buses on schedule despite congestion Ridership increased =less people in cars Rider perception time savings 2X greater than actual
Economic Benefits Capital Cost comparison LRT projects vary in cost from $15 million to $100 million per mile, with the average cost per mile approximately $46 million Cheapest BRT option - $2.5 million to $2.9 million per mile, mixed flow with general traffic, excluding any cost associated with acquiring the right of way. BOS in the Twin Cities range from as little as $1,500 per mile to $200,000 per mile (2007 dollars: avg $150,000 per mile) Operational costs (actual numbers difficult) fewer buses and drivers needed
DESIGN BOS width 10’ min (absolute value) 11.5’ min next to barriers like bridges (12’ preferred) 12’ new construction Thickness Determined by analysis based on soil conditions and the number of buses that will be using the segment As a rule of thumb, the minimum thickness is 7” of bituminous Enough to compensate for variety of underlying material Matches curb and gutter for good compaction Full depth concrete for constructability Catch basins Reinforced as caution Sump reduced from 0.33’ ( 4”) to 0.1’ (1.5”) or less with Water Resources review.
DESIGN Noise Walls Due to updates in 23 CFR 772 a noise analysis is required if the project will be using Federal Funds. The addition of a through-traffic lane(s). This includes the addition of a through-traffic lane that functions as a HOV lane, High-Occupancy Toll (HOT) lane, bus lane, or truck climbing lane. As of January 2012, we have not used any Federal Funds on a stand alone bus shoulder project. We believe that an analysis would not require the installation of noise walls with a bus shoulder project. Rumble Strips Ramp volumes
Watch for Buses on Shoulder sign (posted at entrance ramps or cross streets) Signs Exception sign (posted at “pinch point” on BOS) Typical Shoulder sign (posted approx every 1 mile) “Begin” or “End” signs may be posted above this sign No Special Pavement Markings
MAINTENANCE Maintenance, Snow Removal and Plowing Shoulders cleared of obstructions and snow as part of normal maintenance activities. Routine done in off-peak hrs Maintain BOS (adequate thickness) with mainline Emergency Response Non-issue Bus moves out of way for ANYTHING in the shoulder
FUNDING Capital Costs Mn/DOT – construction $2 million budget Metro Transit – park and rides 1996 – Mn/DOT contributes directly to transit projects 1997 – Team Transit Set-Aside of $2 million/year 2003 bonding package - $46 million to capital costs 2006 – Team Transit budget halved to $1 million 2008 – Bonding Package of $20 million for transit advantages Current budget – varies form $1 to $3 million/year Operational Costs Transit Providers (like Metro Transit) FTA – Fixed-guideway funding – $14.7 million in 2002 FTA no longer classifies Bus Only Shoulders as a fixed- guideway
Driver Training Training Manual Class time Route & Safety Pamphlets Video On-board training
Website http://www.dot.state.mn.us/teamtransit/
Thank You Minnesota Department of Transportation www.dot.state.mn.us/metro/teamtransit/ Contact Carl Jensen Team Transit PM Carl.Jensen@state.mn.us Phone: 651-234-7711
Recommend
More recommend