Burn wounds Burns are one of the most common and devastating forms - - PowerPoint PPT Presentation

burn wounds
SMART_READER_LITE
LIVE PREVIEW

Burn wounds Burns are one of the most common and devastating forms - - PowerPoint PPT Presentation

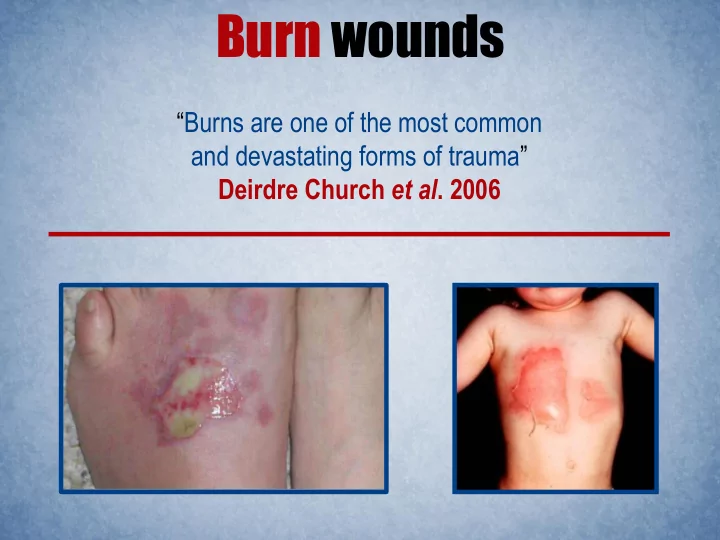
Burn wounds Burns are one of the most common and devastating forms of trauma Deirdre Church et al . 2006 Burn wounds 1,200,000 burn injuries 100,000 hospitalized 5,000 deaths 75% are infection related National Center for Injury


slide-1
SLIDE 1

Burn wounds

“Burns are one of the most common and devastating forms of trauma” Deirdre Church et al. 2006

slide-2
SLIDE 2

Burn wounds

burn injuries 1,200,000

National Center for Injury Prevention and Control in the United States

hospitalized 100,000 deaths 5,000 are infection related 75%

slide-3
SLIDE 3

iGEM Groningen 2014

the smart bandage

slide-4
SLIDE 4

Conventional treatments

Crèmes and bandages Bathing Preventive antibiotics Skin transplantation

slide-5
SLIDE 5

Requirements

the smart bandage

  • Must be used for several days
  • Must detect infections
  • Must secrete infection preventing molecules (IPMs)
slide-6
SLIDE 6

Pseudomonas aeruginosa Staphylococcus aureus

Opportunistic pathogens

Gram-positive Gram-negative

slide-7
SLIDE 7

“A post-antibiotic era - in which common infections and minor injuries can kill - far from being an apocalyptic fantasy, is instead a very real possibility for the 21st Century.” WHO, April 2014

World Health Organization (2014) Antimicrobial resistance: global report on surveillance. ISBN 978 92 4 156474 8

slide-8
SLIDE 8

Our goal

To detect and prevent further infections caused by S. aureus and P. aeruginosa in burn wounds.

slide-9
SLIDE 9

Why Lactococcus lactis ?

  • Harmless species
  • Food approved
  • Produces lactate
  • No spore formation
  • Can be temporarily inactivated

Image adapted from a SEM scan by Joseph A. Heintz, University of Wisconsin-Madison.

slide-10
SLIDE 10

Commission of Genetic Modification

Thomas and Lianne at COGEM.

slide-11
SLIDE 11

How does it work?

DETECTION Quorum sensing molecules AHL (P. aeruginosa) AIP-1 (S. aureus)

Contreras, G. et al. (2013) LaSarre, B. and Michael J.F. (2013)

slide-12
SLIDE 12

How does it work?

BIOFILM DESTRUCTION DspB degrades the biofilms of both species This way the other infection prevention molecules can reach them

Mark, B.L. et al. (2001)

slide-13
SLIDE 13

How does it work?

QUORUM SENSING DISRUPTION AiiA inhibits AHL Quorum sensing of P. aeruginosa is disrupted

  • P. aeruginosa expresses less virulence genes

Body can clear P. aeruginosa without problems

Kim, M.H. et al. (2005)

slide-14
SLIDE 14

How does it work?

NISIN PRODUCTION Nisin kills Gram-positive bacteria

Wiedemann, I. et al. (2001)

slide-15
SLIDE 15
slide-16
SLIDE 16
slide-17
SLIDE 17

Biobricks

Toolbox

  • Nisin biobricks
  • sfGFP

LactoAid

  • AiiA
  • DspB
  • Gene constructs
slide-18
SLIDE 18

From bacterium to bandage

slide-19
SLIDE 19

Bandage materials

Top layer - polymethyl pentane

  • Permeable to gases
  • iGEM 2012, Groningen
slide-20
SLIDE 20

Bandage materials

Middle layer – polyacrylamide gel

  • Pore size is adjustable
  • Nutrients can be added
  • Cheap
  • Rehydratable
slide-21
SLIDE 21

Bandage materials

Bottom layer – cellulose nitrate

  • Permeable to small molecules

and proteins

  • iGEM 2013, TU Delft
slide-22
SLIDE 22

Description of the model

Single unit Total model

slide-23
SLIDE 23

Parameters – Rate Equations

Nisin production assay

Optimal concentration 2% Glucose

slide-24
SLIDE 24

Models

slide-25
SLIDE 25

Model-based design

Least optimal design (0 - 24 h) Max IPMs No IPMs

slide-26
SLIDE 26

Model-based design

Best design (0 - 24 h) Max IPMs No IPMs

slide-27
SLIDE 27

Modeling outcome

Time to reach effective concentrations nisin aiiA dspB 12 min 18 min 18 min 24 min 30 min 30 min 114 min 138 min 144 min

slide-28
SLIDE 28

Modeling outcome

Time to reach effective concentrations nisin aiiA dspB 12 min 18 min 18 min 24 min 30 min 30 min 114 min 138 min 144 min

slide-29
SLIDE 29

Modeling outcome

Time to reach effective concentrations nisin aiiA dspB 12 min 18 min 18 min 24 min 30 min 30 min 114 min 138 min 144 min

slide-30
SLIDE 30

Results: Cell growth in the active layer

slide-31
SLIDE 31

Results: Nisin Secretion

  • Nisin-sensitive strain plated
  • LactoAid active layer,

with nisin-producing strain

slide-32
SLIDE 32

In conclusion

“… this is an application that appeals, it would be a waste if this idea would remain at -80°C…”

slide-33
SLIDE 33

We would like to thank:

slide-34
SLIDE 34

Thank YOU for your attention!

slide-35
SLIDE 35

Wiedemann, I et al. . “peifi Bidig of Nisi to the Peptidogla Preursor Lipid II Coies Pore Foratio ad Ihiitio of Cell Wall Biosthesis for Potet Atiioti Ativit. The Journal of biological chemistry 276(3): 1772–79. Kim, Myung Hee et al. 2005. The Moleular “truture ad Catalti Mehais of a Quoru- Quenching N-Acyl-L-Homoserine Latoe Hdrolase. Proceedings of the National Academy of Sciences

  • f the United States of America 102(49): 17606–11.

Mark, B L et al. 2001. Crstallographi Evidee for “ustrate-Assisted Catalysis in a Bacterial Beta-

  • Hexosaminidase. The Journal of biological chemistry 276(13): 10330–37.

LaSarre, Breah, and Michael J Federle. . Eploitig Quoru “esig to Cofuse Baterial

  • Pathoges. Microbiology and molecular biology reviews : MMBR 77(1): 73–111.

García-Contreras, Rodolfo, Toshinari Maeda, ad Thoas K Wood. . Resistae to Quoru- Quehig Copouds. Applied and environmental microbiology 79(22): 6840–46.

References

slide-36
SLIDE 36

Rate equations

  • M. Boonmee et al. Biochemical Engineering Journal 14 (2003) 127–135

Shimizu et al. Appl. Environ. Microbiol. 1999, 65(7):3134.

X1 = X2 = X3 = x7 = X8 = X9 = X10 = X11 = IPMs =

slide-37
SLIDE 37

Rate equation

F (variable,parameters) Diffusion term

+

Rate =

slide-38
SLIDE 38

Diffusion equations

Volume fraction of the gel: Density of IPMs:

mw - mass of the water mb - mass of the buffer mp - mass of the polymer vp - partial specific volume of gel in water vwb - partial specific volume of gel in buffer

Tong, Jane, and John L. Anderson. Biophysical journal 70.3 (1996): 1505-1513. Fischer Hannes, et al. Protein Science 13.10 (2004): 2825-2828.

slide-39
SLIDE 39

Diffusion equations

Stokes-Einstein equation: Diffusion rates of the IPMs were found with:

Tong, Jane, and John L. Anderson. Biophysical journal 70.3 (1996): 1505-1513.

slide-40
SLIDE 40

Model-based design

Expected most optimal design Max IPMs No IPMs

slide-41
SLIDE 41

Growth rate (0.653 hr-1) 39 minutes

0.01 0.1 1 10 2 3 4 6 7 8 9 10 11

Log OD600nm Time (Hours)

Parameters – Rate Equations

Growth rate – L. lactis

slide-42
SLIDE 42

Rate equation

F (variable,parameters) Diffusion term

+

Rate

=

slide-43
SLIDE 43

Results: Protein production in the gel

30 min 90 min 60 min In the Gel On the Gel

slide-44
SLIDE 44
slide-45
SLIDE 45

Toolbox

Nisin gene cluster

slide-46
SLIDE 46

Nisin production