box jenkins forecasting
play

Box-Jenkins Forecasting - PDF document

Department of Logistics Management Box-Jenkins Forecasting Trend, seasonal factors, causal forecasting


  1. Department of Logistics Management Box-Jenkins Forecasting 傳統預測方式 • 觀察數據變化的型態,選擇影響數據變化的因素 – Trend, seasonal factors, causal forecasting • 如果預測模式合理,預測誤差 (residuals) 接近隨機變化 Box-Jenkins 預測 • 將難以解釋的數據變化輸入 black box • 觀察 black box 產生的預測誤差是否接近 white noise – White noise: 隨機變化的數值,沒有關聯,看不出任何變化型態 • 如果預測誤差不像是 white noise ,再換另一種 black box – Three types of black boxes: MA, AR, ARMA 1 Department of Logistics Management 
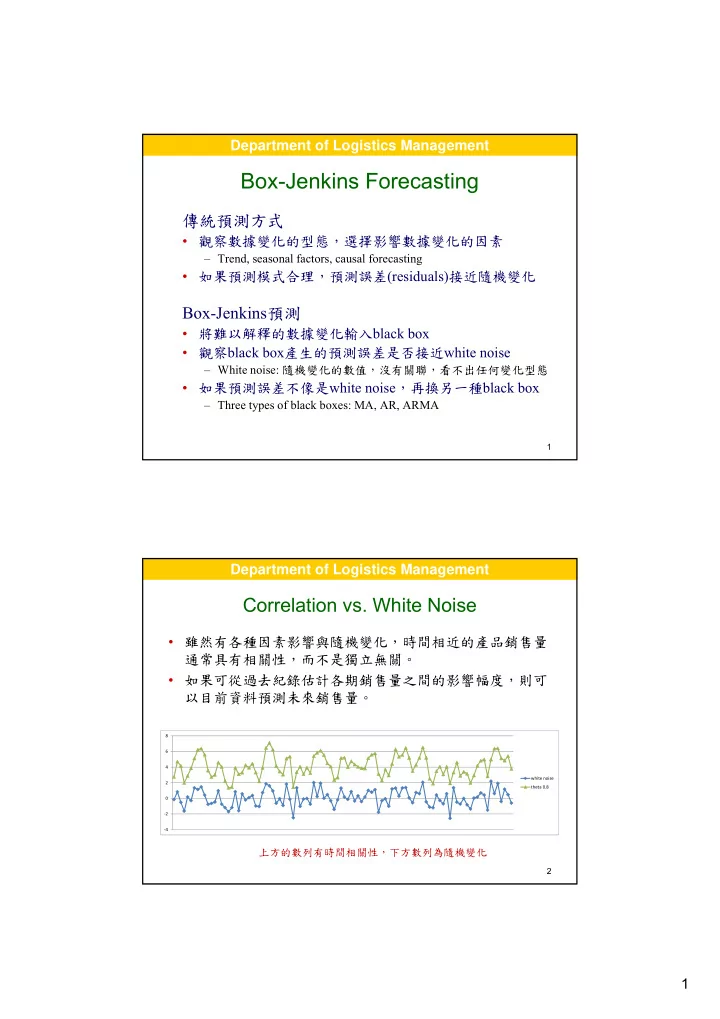
Correlation vs. White Noise • 雖然有各種因素影響與隨機變化,時間相近的產品銷售量 通常具有相關性,而不是獨立無關。 • 如果可從過去紀錄估計各期銷售量之間的影響幅度,則可 以目前資料預測未來銷售量。 8 6 4 white noise 2 theta 0.8 0 ‐ 2 ‐ 4 上方的數列有時間相關性,下方數列為隨機變化 2 1

  2. Department of Logistics Management Correlation Between Random Variables 衡量兩個隨機現象或 covariance cov(X, Y)=E[X-E(X)][Y-E(Y)] 兩組數據間共同變化 的程度 1. cov(X, X)=Var(X) 2. If X and Y are independent, then cov(X,Y)=E(XY)-E(X)E(Y)=0        x x y y i i s cov(X, Y) ≈ XY  n 1 兩組數據間 標準化,不受 X, Y 大小的影響 的相關係數 cov(x,y) corr(x,y)  correlation -1 ≤ corr(x, y) ≤ 1   x y n       x x y y i i    ( X , Y ) i 1 n n     ( x x ) 2 ( y y ) 2 i i 3 i  1 i  1 Department of Logistics Management I. Autocorrelation 同一組銷售數據,時間相近的銷售量可能具有相關性         (t, ) cov(y ,y ) E(y )(y ) autocovariance   t t t t      (t, ) ( ) covariance stationary ( 只與時間差距  有關,與時間 t 無關 )      (0) cov(y ,y ) var(y ) t t t Autocorrelation 標準化,不受單位轉換的影響     cov(y , y ) ( ) ( )       t t  ( )   (0) var(y ) var(y ) (0) (0)  t t 4 2

  3. Department of Logistics Management Estimating Autocorrelation       E (y ) (y )    t t  ( )  =1, 2, 3, …   2 E[(y ) ] t T 1      ( y y )( y y )   t t   T T 1         t 1 y y ˆ ( ) t T T 1   2  ( y y ) t 1 t T  t 1 ˆ ˆ ˆ   ˆ      Partial Autocorrelation y c y y       t 1 t 1 t 考慮其他各期也在同時影響 5 Department of Logistics Management A Simple Example of Autocorrelation 6 3

  4. Department of Logistics Management Autocorrelation Function 觀察各個 autocorrelation 的大小,以挑選適合的 black box: MA, AR, ARMA models one-sided gradual damping gradual damped oscillation 7 Department of Logistics Management 隨機擲銅板,正面贏 $1 ,反面輸 $1 ,觀察累積金額 8 4

  5. Department of Logistics Management Computing Autocorrelations on MINITAB significance level Autocorrelation Function for winnings (with 5% significance limits for the autocorrelations) 1.0 0.8 0.6 0.4 Autocorrelation 0.2 0.0 -0.2 -0.4 -0.6 -0.8 -1.0 1 5 10 15 20 25 30 35 40 45 50 55 60 65 Lag 9 Department of Logistics Management No Autocorrelations for White Noise White noise~N(0,  2 ): 隨機變化,相鄰數值沒有關聯 Time Series Plot of white noise 3 Autocorrelation of white noise 2 1 Autocorrelation Function for white noise white noise (with 5% significance limits for the autocorrelations) 0 1.0 0.8 -1 0.6 0.4 Autocorrelation -2 0.2 0.0 -3 1 20 40 60 80 100 120 140 160 180 200 -0.2 I ndex -0.4 -0.6 white noise process -0.8 -1.0 1 5 10 15 20 25 30 35 40 45 50 Lag 10 5

  6. Department of Logistics Management Example: Canadian Employment Index 1 0.9 0.8 0.7 0.6 0.5 0.4 0.3 0.2 0.1 0 1 2 3 4 5 6 7 8 9 10 11 12 Autocorrelations Quarterly index form 1962.1~1993.4 11 Department of Logistics Management Computing Autocorrelations of CANEMP Autocorrelation Function for caemp (with 5% significance limits for the autocorrelations) 1.0 0.8 0.6 0.4 Autocorrelation 0.2 0.0 -0.2 -0.4 -0.6 -0.8 -1.0 1 5 10 15 20 25 30 Lag 12 6

  7. Department of Logistics Management Computing Partial Autocorrelations Partial Autocorrelation Function for canemp (with 5% significance limits for the partial autocorrelations) 1.0 0.8 0.6 Partial Autocorrelation 0.4 0.2 0.0 -0.2 -0.4 -0.6 -0.8 -1.0 1 5 10 15 20 25 30 Lag Question: 如何挑選符合上一頁與本頁圖形的 black box ? 13 Department of Logistics Management 觀察 Autocorrelations 與 Partial Autocorrelations ,以選擇適當 的 black box 估計 black box 的參數 如果選擇適當的 black box ,預測誤 差 (residual) 應該接近 white noise 14 7

  8. Department of Logistics Management II. Moving Average Models y t = c +  t +  t -1  t is white noise The MA(1) Process 本期的誤差 上期的誤差 1.8 Whitenoise 1.6 MA1 1.4 1.2 1 0.8 0.6 0.4 0.2 0 1 3 5 7 9 11 13 15 17 19 21 23 25 27 29 31 33 35 37 39 41 43 45 47 49 51 53 55 57 59 61  =0 → y t 等於 white noise  >0 → 數據呈現正相關 15 Department of Logistics Management MA(q) Process y t = c +  t +    t -1 +    t -2 +…+  q  t -q    WN(0, 2 ) t MA(2)  1>0,  2>0 MA(2)  1<0,  2>0 Autocorrelation Function for C3 Autocorrelation Function for C3 (with 5% significance limits for the autocorrelations) (with 5% significance limits for the autocorrelations) 1.0 1.0 0.8 0.8 0.6 0.6 0.4 0.4 Autocorrelation Autocorrelation 0.2 0.2 0.0 0.0 -0.2 -0.2 -0.4 -0.4 -0.6 -0.6 -0.8 -0.8 -1.0 -1.0 1 2 3 4 5 6 7 8 9 10 Lag 1 2 3 4 5 6 7 8 9 10 Lag 顯著的項目數 ≈ q 16 8

  9. Department of Logistics Management Autocorrelation and Partial Autocorrelation of MA processes MA process: autocorrelation 圖形前幾段較顯著, partial autocorrelation 為漸進式降低 17 Department of Logistics Management Select MA(4) as Black Box for CANEMP 18 9

  10. Department of Logistics Management Residual Plot of MA(4) Model for CANEMP y t = 99.926 +  t -1 +  t -2 +  t -3 +  t -4 +  t Time Series Plot of CANEMP, Residual, Fitted value 120 20 Variable CANEMP 110 Residual 15 Fitted value 100 10 90 Data 80 5 Residual 70 0 60 -5 50 40 -10 1 13 26 39 52 65 78 91 104 117 Index 19 Department of Logistics Management Autocorrelations of Residuals • 如果 MA(4) 模式合宜, residuals 應該接近 white noise , 而且沒有明顯的 autocorrelations Autocorrelation Function for RESMA(4) (with 5% significance limits for the autocorrelations) 1.0 0.8 0.6 0.4 Autocorrelation 0.2 0.0 -0.2 -0.4 -0.6 -0.8 -1.0 1 5 10 15 20 25 30 Lag 20 10

  11. Department of Logistics Management III. Autoregressive Models y t = ϕ 1 y t -1 +  t    2 The AR(1) Process WN(0, ) t 上期的銷售 本期的誤差 y t = ϕ 1 y t -1 + ϕ 2 y t- 2 +  t The AR(2) Process 7 AR1 6 AR2 5 4 3 2 1 0 1 11 21 31 41 51 61 71 81 91 101 111 121 131 141 151 161 171 181 191 21 Department of Logistics Management Autocorrelations of AR(1) Process 1 0.9  =0.4 0.8 0.7 0.6 0.5 0.4 0.3 0.2 0.1 0 1 2 3 4 5 6 7 8 9 10 11 12  =0.95 What if  <0? 22 11

  12. Department of Logistics Management AR(p) Process y t = ϕ 1 y t -1 + ϕ 2 y t- 2 + … + ϕ p y t-p +  t    WN(0, 2 ) t Autocorrelation Function for AR(2) AR(2) (with 5% significance limits for the autocorrelations) 1.0 0.8 Partial Autocorrelation Function for AR(2) (with 5% significance limits for the partial autocorrelations) 0.6 0.4 Autocorrelation 1.0 0.2 0.8 0.0 0.6 Partial Autocorrelation -0.2 0.4 -0.4 0.2 -0.6 0.0 -0.8 -0.2 -1.0 -0.4 2 4 6 8 10 12 14 16 -0.6 18 20 22 24 Lag -0.8 -1.0 2 4 6 8 10 12 14 16 18 20 22 24 Lag 23 Department of Logistics Management Autocorrelation and Partial Autocorrelation of AR Processes Autocorrelations:        ( ) 1 , 2 , 3 ,  Partial autocorrelations:     , 1     p( )    0, 1  24 12

  13. Department of Logistics Management Residual Plot of AR(2) Model for CANEMP y t = 2.2382 + 1.5235  y t -1  0.5463  y t- 2 +  t Time Series Plot of CANEMP, Residual2, Fitted 2 120 20 Variable 110 CANEMP 15 Residual2 Fitted 2 100 10 90 Data 80 5 Residual2 70 0 60 -5 50 40 -10 1 13 26 39 52 65 78 91 104 117 Time 25 Department of Logistics Management AR(2) Model Residual Sample Autocorrelation Autocorrelation Function for RESAR(2) (with 5% significance limits for the autocorrelations) 1.0 0.8 0.6 0.4 Autocorrelation 0.2 0.0 -0.2 -0.4 -0.6 -0.8 -1.0 1 5 10 15 20 25 30 Lag • Residuals 沒有明顯的 autocorrelations , AR(2) 為合宜模式 26 13

Download Presentation
Download Policy: The content available on the website is offered to you 'AS IS' for your personal information and use only. It cannot be commercialized, licensed, or distributed on other websites without prior consent from the author. To download a presentation, simply click this link. If you encounter any difficulties during the download process, it's possible that the publisher has removed the file from their server.

Recommend


More recommend