birds eye view of pet population trends vet usage patterns pet - - PDF document

bird s eye view of
SMART_READER_LITE
LIVE PREVIEW

birds eye view of pet population trends vet usage patterns pet - - PDF document

9/25/2019 Competing for the Pet Care Consumer David Sprinkle Research Director, Packaged Facts birds eye view of pet population trends vet usage patterns pet product channel purchasing patterns competitive landscape/product &


slide-1
SLIDE 1

9/25/2019 1

Competing for the Pet Care Consumer

David Sprinkle Research Director, Packaged Facts

bird’s eye view of …

pet population trends vet usage patterns pet product channel purchasing patterns competitive landscape/product & service remix

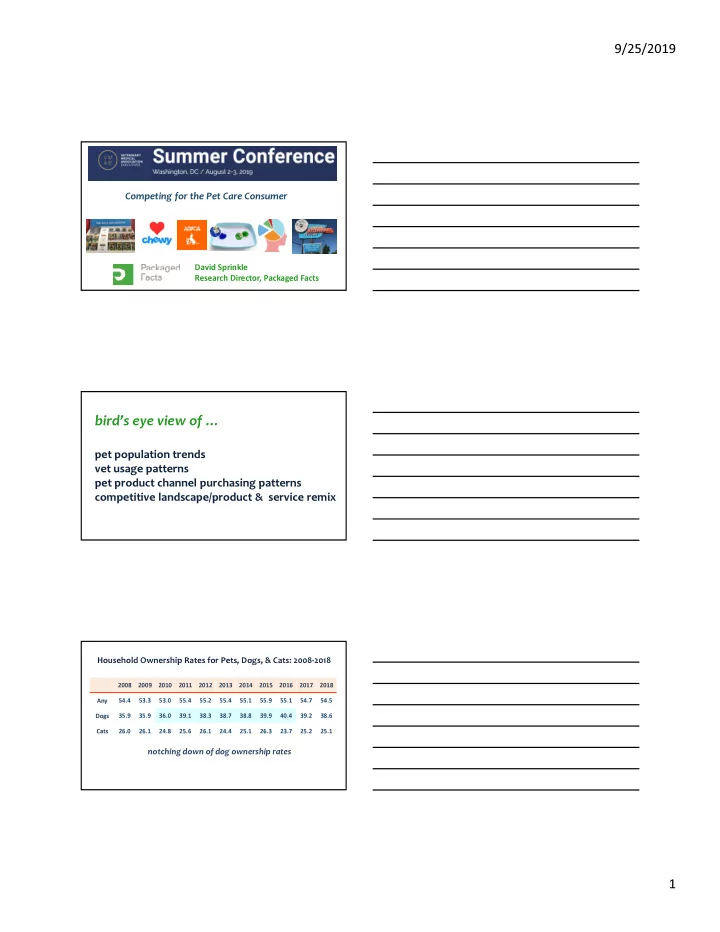
Household Ownership Rates for Pets, Dogs, & Cats: 2008-2018

2008 2009 2010 2011 2012 2013 2014 2015 2016 2017 2018 Any 54.4 53.3 53.0 55.4 55.2 55.4 55.1 55.9 55.1 54.7 54.5 Dogs 35.9 35.9 36.0 39.1 38.3 38.7 38.8 39.9 40.4 39.2 38.6 Cats 26.0 26.1 24.8 25.6 26.1 24.4 25.1 26.3 23.7 25.2 25.1

notching down of dog ownership rates

slide-2
SLIDE 2

9/25/2019 2

Do you have a veterinarian that you regularly go to? (in-field July/August 2019 survey)

Yes 81% No 19% Yes 70% No 33% In last 12 months, what type of veterinary clinic have you used for your dog(s)? (in field July/August 2019 survey)

54% 17% 12% 12% 10% 10% 9% 8% 8% 8% 8% 7% Local, independent vet Chain vet located at pet store Chain vet located in pet store Specialty clinic Emergency clinic Humane society/animal shelter Vet clinic at Walmart Spay & nueter clinic Mobile/at home vet service Mobile/public pop-up vet service Online/telemedicine consultation Holistic/alternative vet

Which of the following, if any, were involved in the actual acquisition your most recent dog?

44% 26% 23% 20% 18% 12% 11% Family members/friends Social media Internet/websites Veterinarian Pet store None of the above Store other than pet 44% 38% 25% 20% Family members/friends Social media + Internet Pet store + Other type store Veterinarian

slide-3
SLIDE 3

9/25/2019 3

$iteWorth Daily Unique Visits Chewy.com 63,670 PetSmart.com 34,916 Petco.com 31,304 Petfinder.com 30,497 1800petmeds.com 6,399

slide-4
SLIDE 4

9/25/2019 4

59% 20% 18% 4% 2%

Inside only (other than… Mostly but not always… Mixed inside/outside Outside only Mostly but not always…

Do you keep your dogs inside or out?, 2019

Inside only

I have a dog that sometimes has anxiety/stress issues. Disagree 52 Somewhat agree 31 Strongly agree 17 I have a dog that sometimes has behavioral problems. Disagree 54 Somewhat agree 31 Strongly agree 14 I have a cat that sometimes has anxiety/stress issues. Disagree 64 Somewhat agree 22 Strongly agree 14 I have a cat that sometimes has behavioral problems. Disagree 58 Somewhat agree 30 Strongly agree 14

slide-5
SLIDE 5

9/25/2019 5

“I like the idea of therapeutic cannabis (CBD/hemp) products for my dog”

19% 20% 31% 11% 20% Strongly agree Somewhat agree Neither agree/disagree Somewhat disagree Strongly Disagree

Dog/Cat Owners: In last 12 months, have you bought Rx flea/tick or heartworm medications with an Rx from your vet, but not directly through your vet?

Yes: 24%

28% 32% 37%

Pets Owned Hhld Income Bracket Number of Households (millions) Change, 2008 vs. 2018 Change, 2016 vs. 2018 2008 2016 2018 Dogs $150K+ 4.6 6.5 8.2 77.2% 26.0% Cats $150K+ 3.1 2.9 4.1 34.4% 41.8% Dogs $100K-$149K 6.4 8.6 9.9 56.2% 15.0% Cats $100K-$149K 4.7 4.7 5.0 6.5% 6.7% Dogs $25K-$49K 8.5 11.6 8.8 2.7%

  • 24.5%

Cats $25K-$49K 6.3 7.1 5.8

  • 9.4%
  • 19.4%

Dogs < $25K 6.5 8.3 6.5 0.6%

  • 20.9%

Cats < $25K 5.2 6.5 4.9

  • 6.0%
  • 24.7%

Hhld Income Bracket Change, 2008 vs. 2018 Change, 2016 vs. 2018 $150K+ 78.6% 16.4% $100-$149K+ 41.9% 9.1% $25K-$49K

  • 11.1%
  • 6.2%

<$25K

  • 11.1%
  • 6.2%

Patterns by Income Bracket

slide-6
SLIDE 6

9/25/2019 6

Dog/Cat Household Population by Locale, 2004-2018

Households (000) Spring 2004 Spring 2018 Chg Total 50,301 63,504 26% Top 25 Metro Areas 21,336 31,268 47% Top 26-100 Metro Areas 14,673 22,970 57% not Top 100 Metro Areas 14,292 9,266

  • 35%

pet health & wellness, like human health h & w, is increasingly subject to the complications and constrictions of urban life

“I am buying pet products online more than I used to”

2012 2013 2014 2015 2016 2017 2018 Strongly Agree 6 8 11 15 18 20 24 Somewhat Agree 12 14 14 18 19 20 16 No Opinion/ Not Applicable 19 23 25 20 20 19 27 Somewhat Disagree 20 18 15 17 14 13 20 Strongly Disagree 43 38 35 29 29 27 12

Dog/Cat Owner Households: Online Pet Product Shopping Rates (%) by Age Bracket

2010 2011 2012 2013 2014 2015 2016 2017 2018 Age 18-24 7.3 4.4 5.3 3.2 3.8 6.9 13.9 21.4 21.5 Age 25-34 6.3 8.9 8.0 5.5 10.5 11.5 15.2 28.8 26.5 Age 35-44 7.5 8.2 6.2 7.9 10.0 10.1 15.3 15.9 20.3 Age 45-54 6.8 6.5 7.1 8.6 10.5 8.4 11.1 15.4 24.5 Age 55-64 5.5 8.0 7.4 7.3 9.5 7.6 14.1 13.6 15.4 Age 65-74 6.3 4.4 6.2 3.1 5.4 6.2 9.7 14.6 18.7 Age 75+ 1.9 5.1 4.6 2.8 7.1 4.5 4.3 5.6 8.8

slide-7
SLIDE 7

9/25/2019 7

Dog/Cat Owner Households: Pet Product Shopping Rates (%) by Channel, 2010-2018

2010 2011 2012 2013 2014 2015 2016 2017 2018 PetSmart/Petco 42.0 42.3 42.9 44.3 44.4 44.4 46.9 45.9 46.8 Supermarkets 43.0 44.0 42.8 42.6 42.9 41.3 47.0 45.8 44.2 Discount Stores 28.0 26.2 26.2 24.2 25.4 22.0 25.7 24.4 21.1 Online 6.3 7.2 6.8 6.3 9.0 8.6 12.7 17.2 20.4 Other Pet Stores 11.9 11.5 11.5 13.9 11.9 10.8 15.6 14.6 14.4 Wholesale Clubs 10.4 9.2 11.7 10.4 10.6 9.4 12.4 11.0 12.0 Veterinarians 16.0 15.1 13.6 14.1 14.2 14.6 14.6 12.1 9.4

flea/tick medication segment will be larger

  • n Amazon than in Walmart by 2020

(first pet category to accomplish that)

slide-8
SLIDE 8

9/25/2019 8

23% 22% 20% 15% 12% 9% Amazon.com (main website) Walmart.com Chewy.com Pet specialty store website Amazon.com (third-party seller) Veterinarian's website

In the last 3 months, through which websites have you purchased pet products? 2019

Pet Product Cross-Shopping Index by Channel, 2018 (an index of 100 represents the norm)

Online PetSmart/ Petco Vets Super- markets Discount Online 137 164 82 71 PetSmart/Petco 137 139 92 89 Veterinarians 164 139 115 128 Supermarkets 82 92 115 96 Discount Stores 71 89 128 96

slide-9
SLIDE 9

9/25/2019 9

increasing concern about pet health and wellness also leads to increasing “functionalization” of products premiumized pet products provide healthcare services The Internet hasn’t divided the industry into e-commerce

  • vs. brick-and-mortar sales: instead, it has made the industry
  • mnichannel. The strongest industry players and customer

relationships therefore skew toward omnichannel.

slide-10
SLIDE 10

9/25/2019 10

Like the distinction between B&M and e-tailer, the distinction between pet services and products--and between medical and non-medical segments of each-- is breaking down. The strongest business models and customer relationships therefore skew toward progressive service + product relationships. Pet Owners Overall: Done in the last 30 days

67% 38% 21% 16% Ordered any types of products/goods

  • nline.

Ordered any types of pet products

  • nline.

Ordered any types of products/goods

  • nline for pick-up in a store.

Ordered any type of pet products

  • nline for pick-up in a store.

mindshare and consumer pain points