
SLIDE 1
By Chandra Ravada Director of Transportation
.
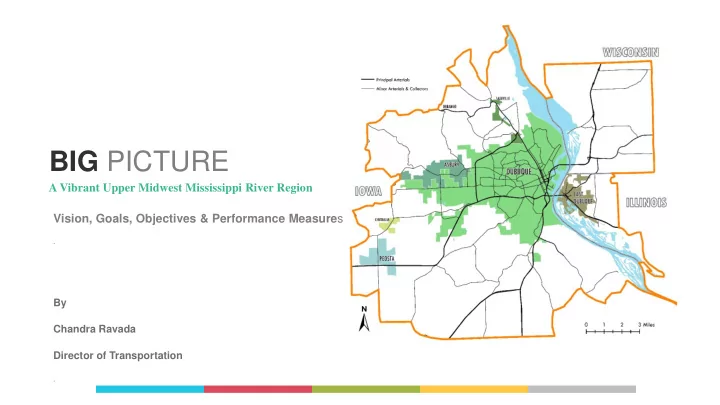
BIG PICTURE
A Vibrant Upper Midwest Mississippi River Region Vision, Goals, Objectives & Performance Measures
.
BIG PICTURE A Vibrant Upper Midwest Mississippi River Region Vision, - - PowerPoint PPT Presentation
BIG PICTURE A Vibrant Upper Midwest Mississippi River Region Vision, Goals, Objectives & Performance Measure s . By Chandra Ravada Director of Transportation . Performance-Based Planning PLANNING Strategic Direction Where do we want to
By Chandra Ravada Director of Transportation
.
A Vibrant Upper Midwest Mississippi River Region Vision, Goals, Objectives & Performance Measures
.
PERFORMANCE-BASED PLANNING AND PROGRAMMING
Goals and Objectives Performance Measures Identify Trends and Targets Identify Strategies and Analyze Alternatives Investment Plan Resource Allocation Program of Projects Strategic Direction Where do we want to go? Analysis How are we going to get there? Programming What will it take? Implementation and Evaluation How did we do? Monitoring Evaluation Reporting Develop Investment Priorities PLANNING Quality Data and Public Involvement
Source: FHWA
Tracks progress in achieving the Objectives
Defines focused elements of the Goals
Establishes the overarching vision of the plan
Expands on the Vision Statement in seven areas of emphasis
Details an approach to meet the Performance Measures Top Priorities 1. Transportation projects that place emphasis on maintaining and improving the existing transportation system than on expanding. 2. Transportation projects and programs that reduce greenhouse gas emissions, region’s dependency on oil, reduce vehicle miles traveled and improve regional air quality. 3. Transportation projects should support high-density, mixed used development that helps decrease reliance on personal vehicles. 4. Coordinate amongst the three states to plan for integrating technology into the transportation system. High Priorities 1. Transportation projects that promote healthy lifestyle, like biking and walking. 2. Transportation projects that support revitalization of existing neighborhoods.
1.
2.
3.
4.
5.
1.
Provide multimodal transportation on priority commuter corridors as appropriate based on the character of the adjacent development. 2. Provide essential transit service to urban and suburban areas. 3. Provide higher-quality transit service to transit oriented development (TOD) nodes throughout the community. 4. Provide more on-road bicycle facilities throughout the community. 5. Provide more trails to connect destinations throughout the community, including the completion of existing regional and local trail systems. 6. Provide more pedestrian facilities to connect destinations throughout the community.
North-West Arterial and downtown improvements.
downtown improvements.
between employment centers and priority target areas (as identified in Dubuque Smarter Travel and Passenger Transportation Plan).
Travel and Passenger Transportation Plan recommendations.
conditions within priority target areas are at or above regional averages.
Percentage of road system in poor condition within priority target areas established by DMATS.
and curb ramps, in accordance with ADA requirements.
and curb ramps within the region.