
SLIDE 1
Big Data for Air Quality: Sensors, Satellites, and Spatial Analysis, - - PowerPoint PPT Presentation
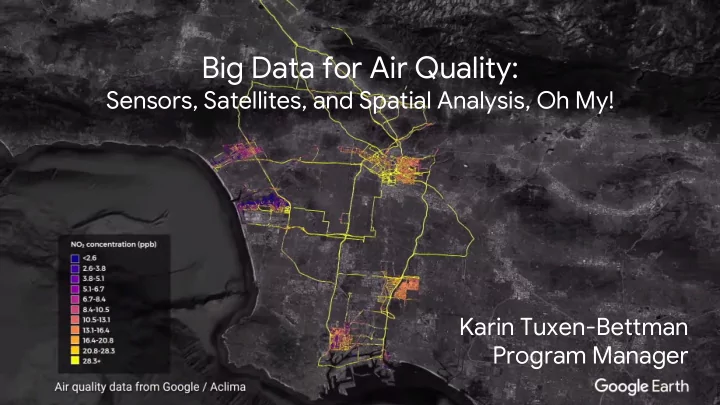
Big Data for Air Quality: Sensors, Satellites, and Spatial Analysis, Oh My! Karin Tuxen-Bettman Program Manager Monitoring Mapping surface Tracking fishing deforestation water over time activity globalforestwatch.org/map
globalfishingwatch.org
global-surface-water.appspot.com
globalforestwatch.org/map
GPS Sensors Air input tube
Scientific-grade equipment: PM 2.5 Ultrafine PM Black Carbon Carbon Dioxide (CO2) Carbon Monoxide (CO) Nitric Oxide (NO) Nitrogen Dioxide (NO2) Ozone (O3)
Black Carbon in Oakland, CA
(from diesel trucks and other sources)
www.edf.org/airqualitymaps
Apte et al 2017. “High-Resolution Air Pollution Mapping with Google Street View Cars: Exploiting Big Data” Environmental Science & Technology.
Health Impacts in Oakland, CA
(from diesel trucks and other sources)
www.edf.org/airqualitymaps/how-pollution-i mpacts-human-health
Alexeef et al 2017. “High-resolution mapping of traffic related air pollution with Google street view carsand incidence of cardiovascular events within neighborhoods in Oakland, CA” Environmental Health.
Street View cars
...and other mobile fleets
Government & regulatory monitoring stations
Consumer devices
Devices deployed by cities, universities, and companies
public data public data public data Other people’s shared data your
private data
Link
public data public data public data Other people’s shared data your
private data
Confidential + Proprietary
250m daily
NOAA NCEP, OMI, ...
10-30m, 14-day
MODIS AQ data Weather & Climate Terrain & Land Cover Landsat & Sentinel
Street View cars
...and other mobile fleets
Government & regulatory monitoring stations
Consumer devices
Devices deployed by cities, universities, and companies
MODIS AQ data Weather & Climate Terrain & Land Cover Landsat & Sentinel
Source: https://www.nasa.gov/topics/earth/features/health-sapping.html