SLIDE 3 33
… it has low data-ink ratio
34
… it is visually dense Some questions remain
people use to
○ store into memory? ○ retrieve from memory?
make a difference?
remember?
- Same data
- More labels
- Less participants (33)
- More time
- + Eye tracking
- + Word descriptions
35 36 37
Step 1: Encode
38
Step 2: Recognize
39
Step 3: recall
40
Does giving more time make a difference?
41
What do people look at?
42
Most recognizable Encoding Least recognizable Recognition “Percent of people born on each day of the year. X-axis is month Y-axis is day. Most popular birthdays are in late summer and early fall.”
- Quality was rated from 0 to 3
○ 0 → incorrect or incoherent ○ 3 → visualization topic, what data or information is presented in the visualization, the main message of the visualization, and one additional specific detail about the visualization
43
Evaluating recall
“this was a chart of most common birthdays. the darker the color the more common the birthday. september was the darkest month”
Titles help!
44
So does redundancy!
Description quality
Titles improve recall quality
Description quality
Strengths and weaknesses
45
Strengths
46
- First dataset of its kind
- High quality, transparent
- research. All the data is
available online.
- Props for collecting verbal
descriptions of visualizations → machine learning (:
- Data is very skewed
- Who would think tables
are memorable?
- Infographics != infovis
- Maybe scientific
visualizations are inherently harder to understand
47
Weaknesses
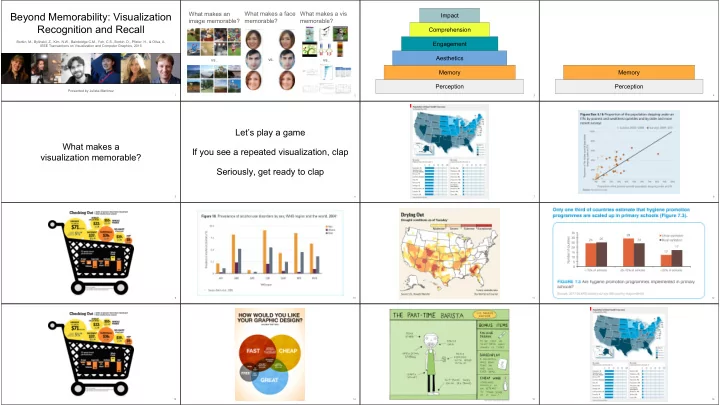
Beyond Memorability: Visualization Recognition and Recall
Borkin, M., Bylinskii, Z., Kim, N.W., Bainbridge C.M., Yeh, C.S., Borkin, D., Pfister, H., & Oliva, A. IEEE Transactions on Visualization and Computer Graphics, 2015 Presented by Julieta Martinez
48