
SLIDE 1
1
Lecture 16: Particle Filters
CS 344R/393R: Robotics Benjamin Kuipers
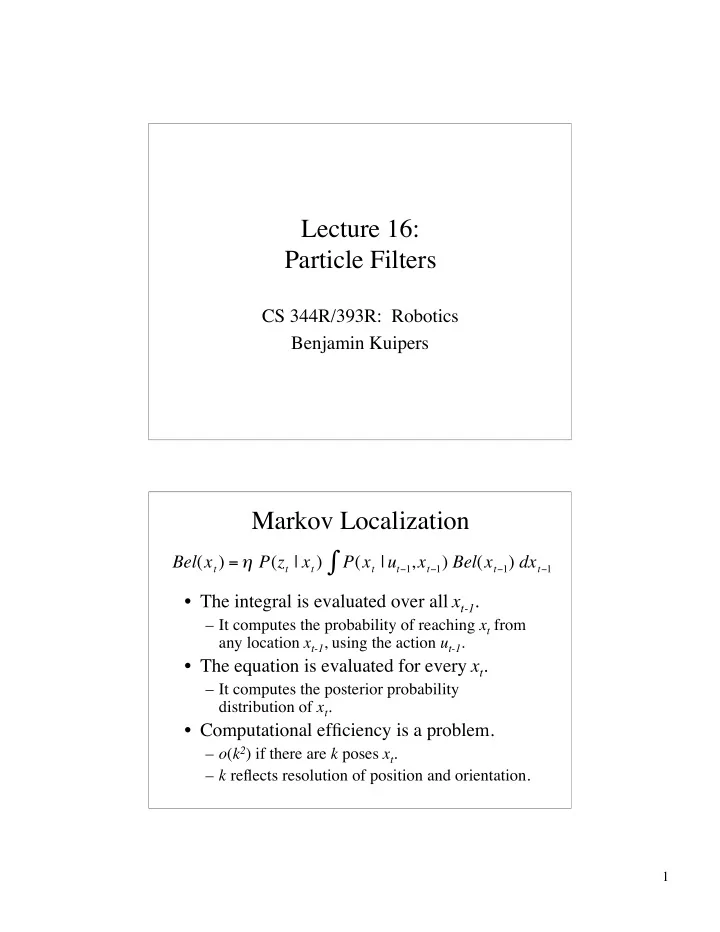
Markov Localization
- The integral is evaluated over all xt-1.
– It computes the probability of reaching xt from any location xt-1, using the action ut-1.
- The equation is evaluated for every xt.
– It computes the posterior probability distribution of xt.
- Computational efficiency is a problem.
– o(k2) if there are k poses xt. – k reflects resolution of position and orientation.
Bel(xt) = P(zt | xt) P(xt | ut1,xt1)
- Bel(xt1) dxt1