
SLIDE 1
Napa County
Baseline Data Report: Biological Inventory
Presentation to the
Watershed Information Center & Conservancy
- f Napa County (WICC)
February 24, 2005
Baseline Data Report: Biological Inventory Presentation to the - - PDF document
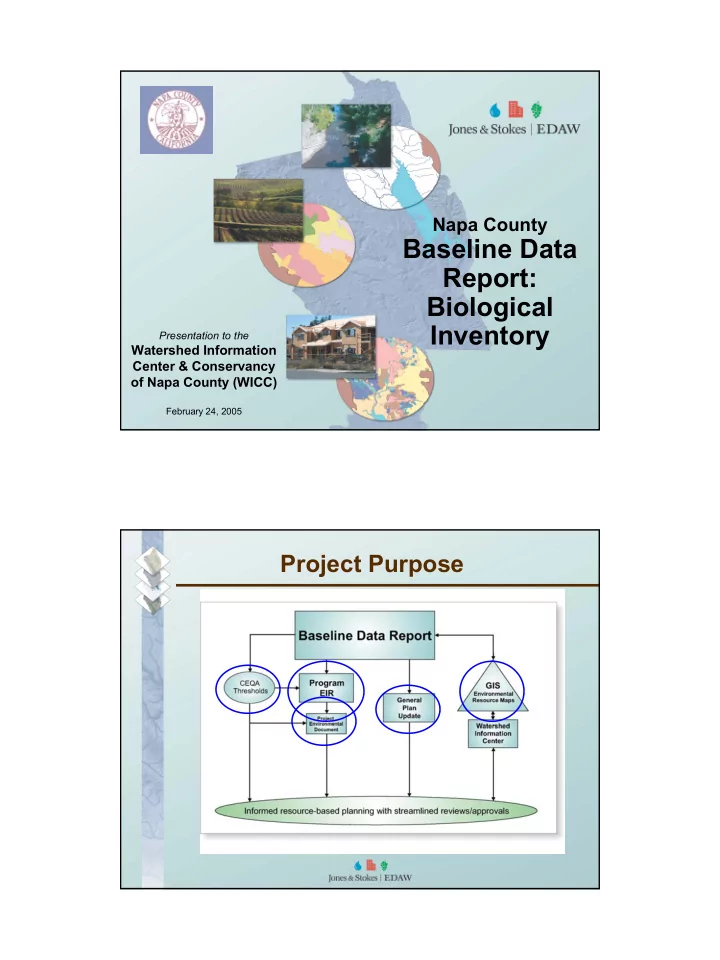
Napa County Baseline Data Report: Biological Inventory Presentation to the Watershed Information Center & Conservancy of Napa County (WICC) February 24, 2005 Project Purpose Project Purpose Biological Resources Inventory Biological
Presentation to the
February 24, 2005
Unique regional data set 59 land cover types, almost 30,000 polygons 2.5 acre MMU, based on 1993 air photos
key ecological processes management issues
sensitive biological resources management issues
regulatory setting special status species wildlife movement care and feeding of biological database
85% have less then 10 known occurrences 2 plants only found in Napa County
2/3 of the special status wildlife species are birds
Associated with 36% of the County’s special
Mapped on 0.4% of the County’s area
serpentine chaparral (30%)
Vegetation types Special Status Species Occurrences Wildlife movement predictions Vernal pool layer
Habitat preferences and distribution Regulatory status Plant blooming time- scheduling surveys
Biological Constraints
Survey needs- which species at what season Impact Analysis Mitigation Planning Provides focus for required
Conservation & Open Space Planning Transportation/Infrastructure planning General Plan Updates Specific Plans Program EIRs Policy development
Fuels Management
CNDDB (every 6 months) Ag/Development (every 2 years) Recovery after wildfires (as needed) Vernal pool data (every 5 years) New unique datasets (as available) Special status species regulatory status Refinement of species distributions with new data
Initial site planning Regional planning Public information