
SLIDE 1
1
Managing Service Inventory
- Reasons to Hold Inventory
- Inventory Models
- News Vendor Problem
- ABC Classification
Shin‐Ming Guo NKFUST
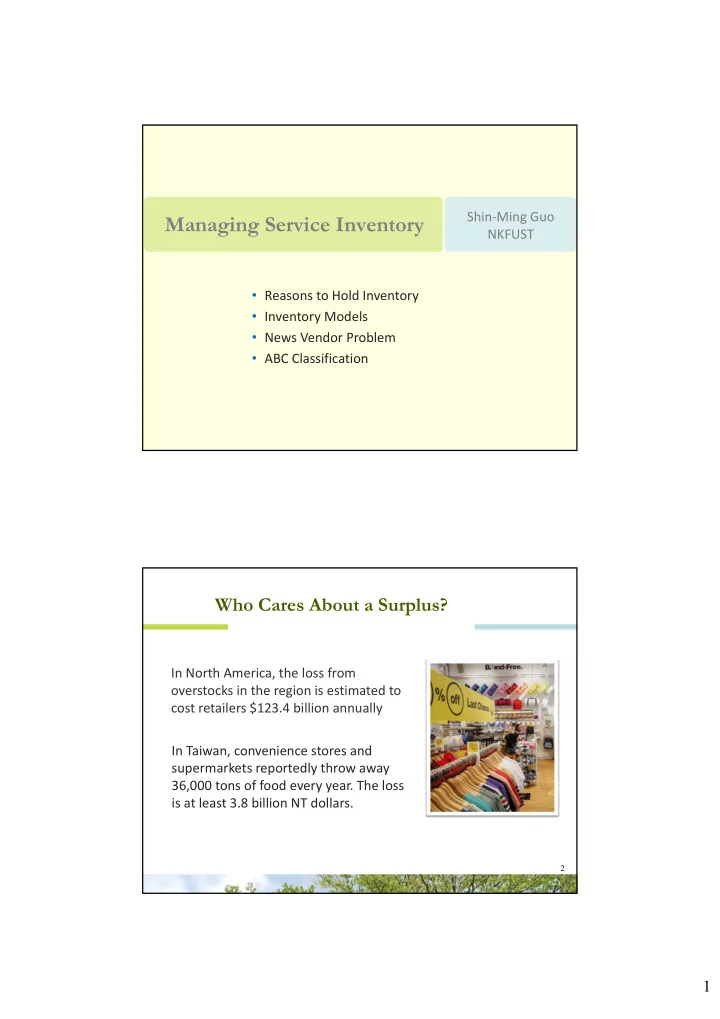
Who Cares About a Surplus?
2
In Taiwan, convenience stores and supermarkets reportedly throw away 36,000 tons of food every year. The loss is at least 3.8 billion NT dollars. In North America, the loss from
- verstocks in the region is estimated to