BACKGROUND Waste and Climate Change Avoided E missions Virgin - - PDF document

background
SMART_READER_LITE
LIVE PREVIEW

BACKGROUND Waste and Climate Change Avoided E missions Virgin - - PDF document

The global impact of Black Carbon Emissions from the Uncontrolled Burning of Solid Waste Natalia Reyna Bensusan Professor Stephen Smith Professor David Wilson Department of Civil and Environmental Engineering s.r.smith@imperial.ac.uk ,


slide-1
SLIDE 1

1

The global impact of Black Carbon Emissions from the Uncontrolled Burning of Solid Waste

Natalia Reyna Bensusan Professor Stephen Smith Professor David Wilson

Department of Civil and Environmental Engineering

s.r.smith@imperial.ac.uk , n.reyna14@imperial.ac.uk 6th International Conference on Sustainable Solid Waste Management, Naxos, Greece
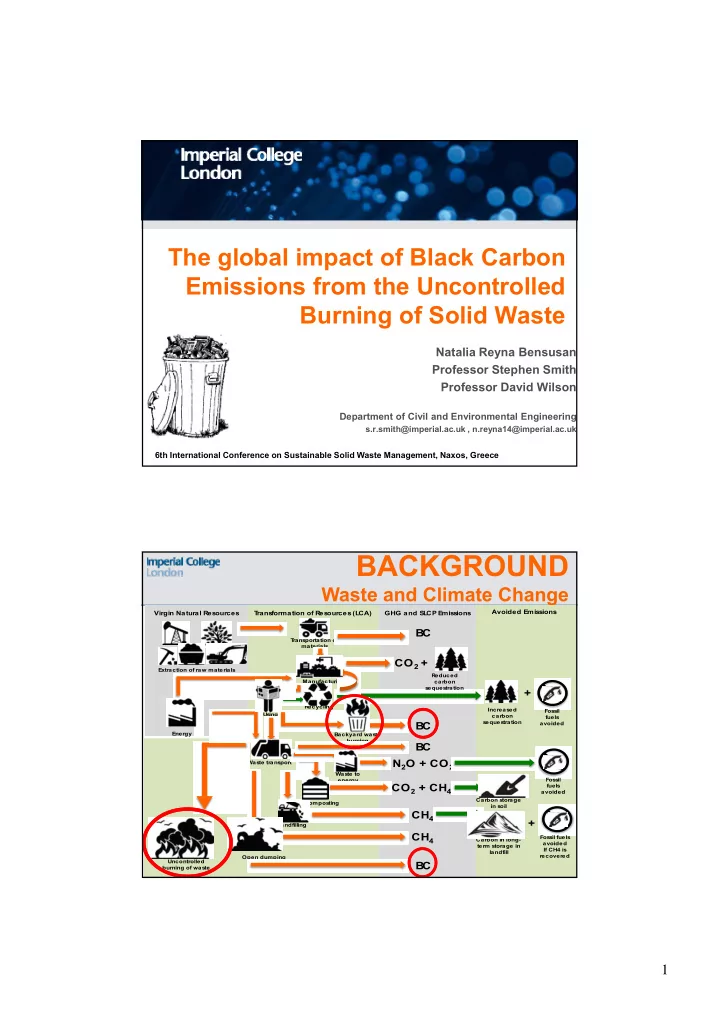
BACKGROUND

Waste and Climate Change

Virgin Natural Resources T ransformation of R esources (L CA) Avoided E missions GHG and S L CP E missions

E nergy Manufacturing Composting R ecycling and reusing Using Uncontrolled burning of waste B ackyard waste burning T ransportation of materials Waste transport L andfilling Increased carbon sequestration Open dumping Fossil fuels avoided E xtraction of raw materials

C

Carbon storage in soil Carbon in long- term storage in landfill Waste to energy

B C B C B C CH4 CH4 CO2 + CH4

Fossil fuels avoided

+ B C N2O + CO2

Fossil fuels avoided If CH4 is recovered

+

R educed carbon sequestration

CO2 +

slide-2
SLIDE 2

2

  • BC is formed from incomplete combustion of

biomass or fossil fuels

  • It is a short lived climate pollutant (SLCP): life time

varies from a few days to a few weeks

  • Its average GWP is 2200 (20 year horizon)
  • The GWP of methane is 86 (20 year horizon)

THEREFORE … BC reductions would reduce the rate of warming soon after measures are implemented

BACKGROUND

W hat is BC?

BACKGROUND

Open burning of waste (OBW)

 BC emissions from OBW are not included in emission

inventories (IPCC, etc.): Emission factors (EF)*** have high degrees of uncertainties

 They were developed with 2-3

measurements

 They are relevant only to certain waste

compositions

Activity levels are difficult to estimate

 No data on open burning is collected  Fires are small and difficult to detect

with satellites

PUBLISHED ESTIMATIONS FOR OBW

 620 million t year-1 of waste burned in backyards*  350 million t year-1 of waste burned in dumpsites*  270 thousand premature deaths per year**

SOURCES *Wiedinmyer et al. (2014) **Kodros et al. (2016)

*** Emission Factor = mass of a pollutant emitted per unit mass of material burned

slide-3
SLIDE 3

3

OBJECTIVES

  • 1. To develop a methodology to measure BC EFs for
  • pen burning waste
  • 2. To measure BC EFs for single waste types
  • 3. To measure mixed waste BC EFs for a developing

country (Mexico)

  • 4. To calculate regional EFs based on the waste

composition in different areas of the world

  • 5. To place the BC emissions from open burning into

context (compare to CH4).

FIELDWORK

Waste characterisation, surveys and interviews

slide-4
SLIDE 4

4

LABORATORY EXPERIMENTATION

Determining EFs for open burning of waste

Waste combustion emission sampler Filter with BC emissions

1

Waste samples

LABORATORY EXPERIMENTATION Filters with BC: Difference in ATN

ATN 35.8 106.1 181.5 218.0 466.1 Filter Magee Transmissometer OT21

2

ATN Sunset EC/OC Analyser

3

EC ≈ BC

slide-5
SLIDE 5

5

RESULTS

Analysis of Com bustion Patterns

Waste type Repetitions Samples with ATN>500* Fraction Burned (%) Emissions Captured/Sa mple Burned (%) Total Combustible Mass (%) Remaining Volatile Fraction (%) ATN

Paper & cardboard

n=23 64.9 1.6 90.5 24.4 62 (±77)

Garden

n=15 2 57.1 0.9 93.7 41.6 264 (±122)

Textiles

n=14 5 51.1 1.1 99.7 48.8 363 (±114)

LDPE

n=17 23.8 0.3 84.3 59.8 46 (±67)

HDPE

n=20 4 40.2 0.6 99.9 58.9 147 (±193)

PET

n=17 9 9.9 1 99.6 92.8 383 (±148)

Polystyrene

n=14 4 21.3 3 100 79.5 328 (±162) ATN>500 = filters marked as "Too Dark" by OT21

y = 2.16x2 + 1.93x + 0.31 r² = 0.98 P<0.001

20 40 60 80

  • 1

1 2 3 4 5

BC (μg cm-2 )

ln (Io/I) = ATN/100

Type of waste BC EF (g kg-1, std. dev.)

Individual waste fractions

Paper and cardboard 0.005 (±0.01) Organic waste 0.245 (±0.21) Textiles 42.032 (±27.75) LDPE 0.013 (±0.02) HDPE 0.035 (±0.04) PET 0.715 (±0.80) Polystyrene 92.462 (±81.33)

Mixed waste fractions

Mexico 2.395 (±1.16 ) Case Area 1 (Huejutla, Hidalgo) 1.805 (±1.07 ) Case Area 2 (Juchitán, Oaxaca) 0.823 (±0.90 )

RESULTS

EC/ BC and ATN relationship

Region Constructed EF (g kg-1) AFR 1.15 EAP 1.11 ECA 1.21 SAR 1.16 MENA 0.92 LCR 1.47 OECD 1.27

Using waste composition data for each region

slide-6
SLIDE 6

6

Methane vs. black carbon

AFR: Africa Region EAP: East Asia and the Pacific ECA: Eastern and Central Asia SAR: South Asia Region MENA: Middle East and North Africa LAC: Latin America & the Caribbean OECD: Organisation for Economic Co-operation and Development

(a) EF CH4

(MTCO2Eq Wet t-1) 1.59 0.63 2.3

(b)Waste

burned BC Emission Factors Emissions

(d)Food

waste (t x 106) Garden waste (t x 106) Paper & cardboard (t x 106)

(e)CH4

(MTCO2Eq x 106) BC CO2Eq / CH4 CO2Eq (t x 106) (kg t-1) BC

(c)BC

(t x 106) (MTCO2Eq x 106) AFR 107.3 1.15 0.12 270.9 23.1 15.1 9.7 68.3 4 EAP 396.6 1.11 0.44 971.4 99.1 47.6 39.7 278.5 3.5 ECA 99.2 1.21 0.12 264.6 9.7 27.2 13.9 64.4 4.1 SAR 153.8 1.16 0.18 393.9 31.6 13.6 6.2 72.9 5.4 MENA 61.5 0.92 0.06 125 16.9 3.7 8.6 49.0 2.6 LAC 143.7 1.47 0.21 463.4 28.0 21.5 23.0 110.9 4.2 OECD 10.1 1.27 0.01 28.3 0.6 1.6 3.2 9.4 3 WORLD 972.2

  • 2,518

209.0 130.3 104.2 653.3 3.8 (average)

a) Emission factors for CH4 in metric tonnes of CO2 equivalent per wet ton of waste are taken from the Waste Reduction Model (WARM) (US EPA, 2015). b) Source: Wiedinmyer et al. (2014). c) Average global warming potential (GWP) for BC in a 20 year horizon is 2200 (Bond et al., 2013, Fuglestvedt et al., 2010). d) It was considered that 50% of the food waste is burned as feeding waste to animals and using food waste for compost is a common practice in developing countries. e) Methane emissions from equivalent disposal of waste fractions in landfill.

≈4.7% of total CO2Eq emissions globally

CONCLUSIONS 1

 BC EFs based on waste composition can be

used to estimate local, regional and global impacts from open burning of waste (OBW)

 BC from open burning contributes almost

5% of global CO2Eq emissions

 BC (CO2Eq) emissions from waste burning are

4 times larger compared to CH4 (CO2Eq) emissions from the decomposition of equivalent amounts of combustible biodegradable waste in dumpsites

slide-7
SLIDE 7

7

Reducing OBW would have a significant

and immediate impact on improving air quality, respiratory health, and reducing climate change

Current inventories significantly

underestimate the global emissions from the waste management sector by not including OBW.

CONCLUSIONS 2

THANK YOU

n.reyna14@imperial.ac.uk

REFERENCES

Kodros, J. K., Wiedinmyer, C., Ford, B., Cucinotta, R., Gan, R. & Magzamen, S.

  • 2016. Global burden of mortalities due to chronic exposure to ambient PM2.5

from open combustion of domestic waste. Environmental Research Letters, 11

Wiedinmyer, C., Yokelson, R. J. & Gullett, B. K. 2014. Global emissions of trace gases, particulate matter, and hazardous air pollutants from open burning of domestic waste. Environment, Science and Technology, 48, 9523-9530

slide-8
SLIDE 8

8

Emission factors (g kg-1 waste)

Number of test Burn 1 Burn 2 Burn 3 Average

Christian et al. (2010)

0.38 0.92 0.63 0.65

Stockwell et al. (2016)

0.56 (wet conditions) 6.04 (dry conditions)

  • 3.3

Jayarathne et al. (2017)

  • 2.59*

Mixed waste types (n=repetitions) This research Mexico (n=11) Huejutla (n=13) Juchitán (n=16) Average 2.4 1.81 0.82 1.67 *Three samples were measured but only the average EF was reported.

RESULTS

Com parison of Em ission Factors AVERAGE VALUES

1.98 vs. 1.67

Other studies This research