Background Background The impact of Musculoskeletal Conditions - - PowerPoint PPT Presentation

background background
SMART_READER_LITE
LIVE PREVIEW

Background Background The impact of Musculoskeletal Conditions - - PowerPoint PPT Presentation

Outline What t ar are th the most rel elevant t en envi vironmenta tal fac facto tors in in rel elation to to hea ealth? Background Cristina Bostan 2 , Cornelia Oberhauser 1 , Alarcos Cieza 1,2 Objectives 1 Chair of Public


slide-1
SLIDE 1

What t ar are th the most rel elevant t en envi vironmenta tal fac facto tors in in rel elation to to hea ealth?

Cristina Bostan2, Cornelia Oberhauser1, Alarcos Cieza 1,2

1 Chair of Public Health and Health Care Research

Department of Medical Informatics, Biometry and Epidemiology – IBE Ludwig-Maximilians-University, Marchioninistraße 17, Munich, Germany

2 Swiss Paraplegic Research, Nottwil, Switzerland

Outline

  • Background
  • Objectives
  • Data
  • Methods
  • Results
  • Conclusion

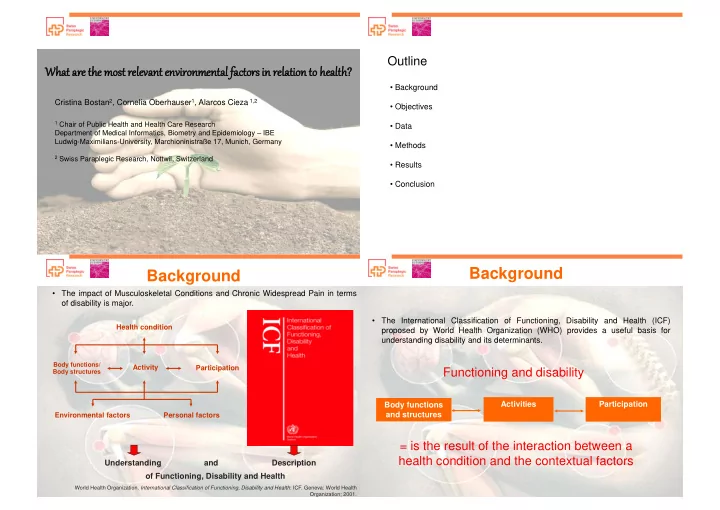
Health condition Environmental factors Personal factors

Body functions/ Body structures

Activity Participation

Understanding and Description

  • f Functioning, Disability and Health

World Health Organization. International Classification of Functioning, Disability and Health: ICF. Geneva: World Health Organization; 2001.

Background

  • The impact of Musculoskeletal Conditions and Chronic Widespread Pain in terms
  • f disability is major.

Background

  • The International Classification of Functioning, Disability and Health (ICF)

proposed by World Health Organization (WHO) provides a useful basis for understanding disability and its determinants. Activities Body functions and structures Participation

= is the result of the interaction between a health condition and the contextual factors Functioning and disability

slide-2
SLIDE 2

Background

Activities and Participation component

Capacity

The level of functioning in health and health-related domains measured as the internal capacity of the person

Performance

The level of functioning in the current environment of the persons taking into account the influences of the environment

Objectives

To answer the question which are the relevant environmental factors explaining the differences between performance and capacity as defined in the ICF.

Data

Data collection  in a cross-sectional survey conducted within „Measuring Health and Disability in Europe: supporting policy development‟ (MHADIE)  297 patients from which:  Low Back Pain (LBP): N= 118  Osteoporosis (OP): N= 87  Osteoarthritis (OA): N= 15  Rheumatoid Arthritis (RA) : N= 24  Chronic Widespread Pain (CWP) : N= 48  Two rehabilitation clinics from Italy and Germany for LBP and OP; this German clinic recruited also patients with CWP, OA and RA.

Data

Measures

 ICF Checklist which includes categories from all four ICF components  29 body functions (b),  16 body structures (s)  48 Activity and Participation (d)  32 environmental factors (e)  for d categories, information on  Capacity  Performance was recorded separately  The qualifier rating scale from 0 to 4 was used

slide-3
SLIDE 3

Methods

Step 1

Capacity scale Performance scale

Partial Credit Rasch models

  • Body Functions
  • Body Structures
  • Capacity
  • Body Functions
  • Body Structures
  • Performance

There were examined: 1) unidimensionality - items contribution to the measurement of capacity and performance, respectively; 2) the structure of the response scale was studied with reference to the ordering of the threshold parameters for each individual ICF‟s response scale; 3) the targeting of the scales; 4) reliability using Person Separation Reliability; 5) differential item functioning (DIF) for health conditions and disease severity.

Results

Capacity Scale – 22 ICF categories Performance Scale – 22 ICF categories

Capacity Scale Performance Scale b152 - Emotional functions √ √ b710 - Mobility of joint functions √ √ b740 - Muscle endurance functions √ √ b780 - Sensations related to muscles and movement functions √ √ s770 - Additional musculoskeletal structures related to movement √ √ d410 - Changing basic body position √ √ d415 - Maintaining a body position √ √ d430 - Lifting and carrying objects √ √ d445 - Hand and arm use √ √ d450 - Walking √ d455 – Moving around √ d470 - Using transportation √ √ d475 – Driving √ d510- Washing oneself √ d530 - Toileting √ d540 - Dressing √ √ d570 - Looking after one's health √ √ d620 - Acquisition of goods and services √ d630 - Preparing meals √ √ d640 - Doing housework √ d660 - Assisting others √ √ d710 - Basic interpersonal interactions √ √ d760 - Family relationships √ √ d770 - Intimate relationships √ √ d910 - Community life √ d920 - Recreation and leisure √ √

Step 1

Results

Mean and standard deviation (SD) of the locations of the persons and items and the index of person separation (IPS).

Capacity scale Performance scale Persons location

  • 1.80 (1.65)
  • 3.37 (1.65)

Fit Residual

  • 0.23 (1.02)
  • 0.24 (0.97)

Index of Person Separation 0.90 0.85

Step 1 Low impairment High impairment Capacity Performance

Methods

Step 2

Capacity scale Performance scale

Body functions and structures Activities & Participation Capacity Activities & Participation Performance Item Response Theory Calibration (Separated IRT Calibration) was used to calibrate both scales of step 1 on a single scale ranging from 0 (low level) to 100 (high level):

  • a scale transformation was performed on the common items;
  • A is the slope, and B is the intercept and is the location of

capacity items

  • scale “transformation constants” are calculated and used to place items

parameters on the common metric scale.

and , where and are the slope parameters,

and are the location or threshold parameters. Body functions and structures

Chen WH, Revicki DA, Lai JS, Cook KF, Amtmann D (2009) Linking pain items from two studies onto a common scale using item response theory. J Pain Symptom Manage 38:615–628

slide-4
SLIDE 4

Results

Relation between Self – reported General Health and Capacity Person Score and Performance Person Score Step 2

Methods

Step 3

Group Lasso method was used to identify those environmental factors that explain the difference between performance and capacity. Why Group Lasso regression?

  • The ICF categories are:
  • measured on an ordinal scale
  • are highly correlated
  • a ranking of the ICF Categories can be established.

Step 3

Results

e340 - Personal care providers and personal assistants e355 - Health professionals e360 - Other professionals e455 - Individual attitudes of health-related professionals e575 - General social support services, systems and policies e110 - Products or substances for personal consumption e310 - Immediate family e360 - Other professionals e455 - Individual attitudes of health-related professionals When they act as facilitator When they act as barrier

Conclusion

Step 1

  • It is the first time that a measure of capacity and a measure of

performance has been calibrated in the same scale so that they can be compared

  • Differences between capacity and performance can be assessed when

using the ICF qualifiers to rate the extent of the problem

  • Environmental factors of all ICF chapters but chapter 2 (natural

environment) are relevant to explain the difference between capacity and performance

slide-5
SLIDE 5

Thank you