B. 6 Mean seasonal thrips per leaf 6 A. a 5 5 a a a 4 4 - - PDF document

b
SMART_READER_LITE
LIVE PREVIEW

B. 6 Mean seasonal thrips per leaf 6 A. a 5 5 a a a 4 4 - - PDF document

Unraveling the interactions among variety, fertility, yield, onion thrips and diseases, and implications for improved management practices Ashley Leach 1 , Stephen Reiners 2 , Marc Fuchs 3 , and Brian Nault 1 1 Department of Entomology, Cornell


slide-1
SLIDE 1

1 2 3 4 5 6

Mean seasonal thrips per leaf

1 2 3 4 5 6

Mean seasonal thrips per leaf

Unraveling the interactions among variety, fertility, yield, onion thrips and diseases, and implications for improved management practices

Ashley Leach1, Stephen Reiners2, Marc Fuchs3, and Brian Nault1 1 Department of Entomology, Cornell University,

New York State Agricultural Experiment Station, 2 Horticulture Section, School of Integrative Plant Sciences, Cornell University, NYSAES, 3 Plant Pathology and Plant-Microbe Biology Section, School of Integrative Plant Sciences, Cornell University, NYSAES,

Onion thrips is an important pest of onion as it feeds directly on onion leaves, and transmits or transfers serious plant pathogens including bacterial bulbs rots (Pantoea spp.) and Iris yellow spot virus (Gent et al 2006, Dutta et al 2014). Insecticide use is the primary method to control onion thrips in onion; however, reliance on insecticides can increase likelihood of insecticide resistance developing (Shelton et al 2006). Thus, other tactics are needed to improve profitability and sustainability of onion production. Promising management tactics include reducing rate of nitrogen and phosphorus fertilizer, selecting cultivars with partial thrips resistance, and using an action-threshold based insecticide program. From 2015 to 2017, we investigated the effect of these management tactics on onion thrips control, onion yield, and associated disease like; Iris yellow spot disease and bacterial bulb rots.

Onion thrips density

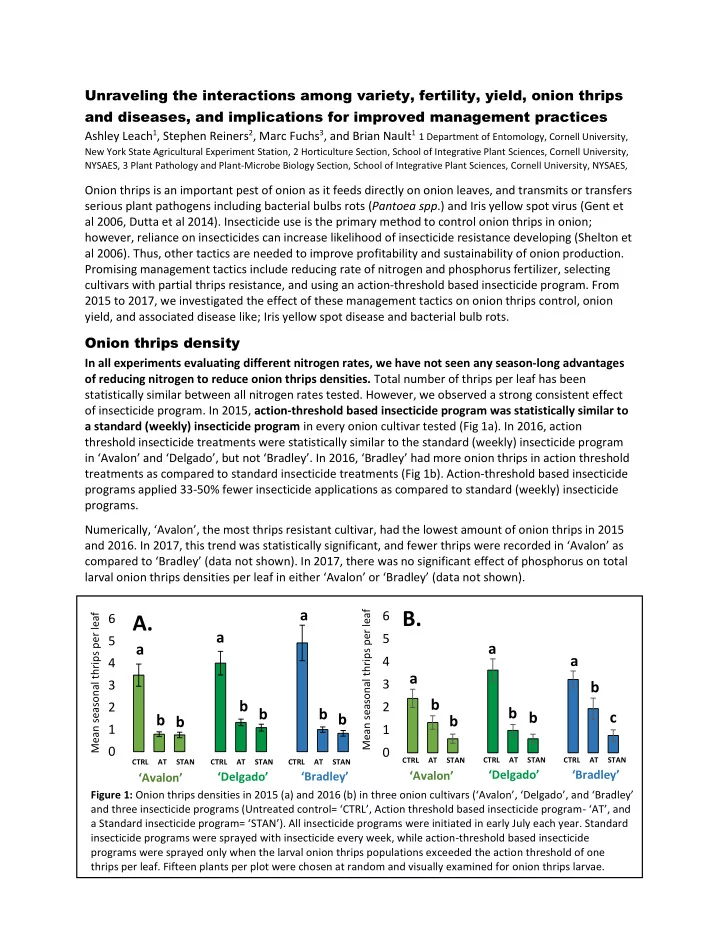
In all experiments evaluating different nitrogen rates, we have not seen any season-long advantages

  • f reducing nitrogen to reduce onion thrips densities. Total number of thrips per leaf has been

statistically similar between all nitrogen rates tested. However, we observed a strong consistent effect

  • f insecticide program. In 2015, action-threshold based insecticide program was statistically similar to

a standard (weekly) insecticide program in every onion cultivar tested (Fig 1a). In 2016, action threshold insecticide treatments were statistically similar to the standard (weekly) insecticide program in ‘Avalon’ and ‘Delgado’, but not ‘Bradley’. In 2016, ‘Bradley’ had more onion thrips in action threshold treatments as compared to standard insecticide treatments (Fig 1b). Action-threshold based insecticide programs applied 33-50% fewer insecticide applications as compared to standard (weekly) insecticide programs. Numerically, ‘Avalon’, the most thrips resistant cultivar, had the lowest amount of onion thrips in 2015 and 2016. In 2017, this trend was statistically significant, and fewer thrips were recorded in ‘Avalon’ as compared to ‘Bradley’ (data not shown). In 2017, there was no significant effect of phosphorus on total larval onion thrips densities per leaf in either ‘Avalon’ or ‘Bradley’ (data not shown).

CTRL AT STAN CTRL AT STAN CTRL AT STAN CTRL AT STAN CTRL AT STAN CTRL AT STAN

‘Avalon’ ‘Delgado’ ‘Bradley’

A.

Figure 1: Onion thrips densities in 2015 (a) and 2016 (b) in three onion cultivars (‘Avalon’, ‘Delgado’, and ‘Bradley’ and three insecticide programs (Untreated control= ‘CTRL’, Action threshold based insecticide program- ‘AT’, and a Standard insecticide program= ‘STAN’). All insecticide programs were initiated in early July each year. Standard insecticide programs were sprayed with insecticide every week, while action-threshold based insecticide programs were sprayed only when the larval onion thrips populations exceeded the action threshold of one thrips per leaf. Fifteen plants per plot were chosen at random and visually examined for onion thrips larvae.

a b b a b b a b b

‘Avalon’ ‘Delgado’ ‘Bradley’

a b b a b b a b c

B.

slide-2
SLIDE 2

100 200 300 400 500 600

a b b a b b a a a

Onion bulb yield

Consistently, we found that plants fertilized with nitrogen had statistically similar marketable yields. In 2015 and 2016, we observed no significant effect of nitrogen rate at planting on marketable yield (data not shown). Plots supplemented with either 60 lbs. N/A, 90 lbs. N/A, or 125 lbs. N/A at planting were not statistically different from one another and had similar marketable yields. However, insecticide program significantly impacted yield in 2015 and 2016 (Figure 3a and b). Those plots treated with insecticide had 10–54% greater marketable yields as compared to those plots that did not receive insecticide. In 2017, there was a limited effect of insecticide program on marketable yield, which is likely due to the low pressure of thrips. The addition of nitrogen fertilizer had a significant effect on yield in 2017; plots supplemented with nitrogen had 66% higher marketable yields as compared to the unfertilized control (which received 0 lbs. N/A). However, all plots that received fertilizer had statistically similar marketable yields (as shown in ‘Avalon’ in Figure 3). In 2017, increased rates of phosphorus increased onion bulb yields; however, differences between treatments were small. Onions supplemented with 150 lbs. P/A had 11% greater marketable yields as compared to those onions supplemented with 0 lbs. P/A (data not shown).

Marketable yield (cwt/acre)

100 200 300 400 500 600

a b b a b b a b b

Marketable yield (cwt/acre)

A.

‘Avalon’ ‘Delgado’ ‘Bradley’

B.

CTRL AT STAN CTRL AT STAN CTRL AT STAN

Figure 2: Onion marketable yield (cwt/acre) in 2015 (a) and 2016 (b) in three onion cultivars (‘Avalon’, ‘Delgado’, and ‘Bradley’ and three insecticide programs (Untreated control= ‘CTRL’, Action threshold based insecticide program- ‘AT’, and a Standard insecticide program= ‘STAN’). All insecticide programs were initiated in early July each year. Standard insecticide programs were sprayed with insecticide every week, while action threshold based insecticide programs were sprayed only when the larval onion thrips populations exceeded the action threshold of one thrips per leaf. Onions were planted in mid to late April on ‘muck’ soil types in Elba, NY. Onions were harvested, cured for one week, and then weighed and graded.

50 100 150 200 250 300 350 400

0 lbs. N/A 60 lbs. N/A 75 lbs. N/A 105 lbs. N/A 135 lbs. N/A

a b b b b

Figure 3: Onion marketable yield (cwt/acre) in ‘Avalon’ in 2017 within 5 rates of nitrogen (0 lbs. N/A at planting, 60 lbs. N/A at planting, 60 lbs. N/A at planting + 15 lbs. N/A (75 lbs. N/A), 60

  • lbs. N/A at planting + 45 lbs. N/A (105 lbs. N/A),

60 lbs. N/A at planting + 75 lbs. N/A (135 lbs. N/A). Onions with split applications of nitrogen were fertilized with additional nitrogen in June. Onions were planted in mid-April on ‘muck’ soil types in Elba, NY. Onions were harvested, cured for one week, and then weighed and graded.

Marketable yield (cwt/acre)

Nitrogen rate

‘Avalon’ ‘Delgado’ ‘Bradley’

CTRL AT STAN CTRL AT STAN CTRL AT STAN

slide-3
SLIDE 3

1 2 3 4

a b b a b b a b b

Iris yellow spot disease

Neither cultivar, nitrogen or phosphorus rate had a significant effect on Iris yellow spot disease in trials from 2015 to 2017. In years where IYS had low incidence and severity, there was no significant effect of insecticide program either. However, in 2016, when IYS was severe, insecticide program had a significant effect on the incidence and severity of the disease (Figure 4). Those onions treated with insecticide (using either a standard or action-threshold-based insecticide program) had fewer plants expressing IYS disease symptoms early in the season in every cultivar. Furthermore, at the end of the growing season those plots treated with an action threshold or standard insecticide program had a reduced level of disease severity, with an average reduction of 16-30% in IYS severity (Figure 4).

Bacterial bulb rots

Bacterial bulb rot was not consistently impacted by onion thrips control or nitrogen rate at planting in trials in 2015 or 2016 (data not shown). Numerically, there was a greater incidence of bacterial rot in ‘Avalon’ in 2015 and 2016. In 2017, we observed greater numbers of rotten bulbs in ‘Avalon’ compared with ‘Bradley’, but this varied with rate of nitrogen applied (Figure 6). Overall, in 2017, nitrogen fertilizer had the greatest impact on the number of onion bulbs with decay during the growing season and at harvest (Figure 6). Plots that received nitrogen fertilizer had approximately 3 times the rot as compared to those plots that did not receive any fertilizer. At harvest, there was also an effect of insecticide program on the incidence of bacterial rot in onions, as

  • nions treated with insecticide had almost twice as much

bacterial rot as those onions without insecticide (Figure 5). CTRL AT STAN CTRL AT STAN CTRL AT STAN ‘Avalon’ ‘Delgado’ ‘Bradley’

Figure 4: Iris yellow spot disease severity in 2016 in three onion cultivars (‘Avalon’, ‘Delgado’, and ‘Bradley’ and three insecticide programs (Untreated control= ‘CTRL’, Action threshold based insecticide program- ‘AT’, and a Standard insecticide program= ‘STAN’). All insecticide programs were initiated early July each year. Standard insecticide programs were sprayed with insecticide every week, while action threshold based insecticide programs were sprayed only when the larval onion thrips populations exceeded the action threshold of one thrips per leaf. Fifteen plants per plot were chosen at random and visually examined iris yellow spot disease. A scale ranging from 0 to 4 was used, where 0 = no lesions, 1= few, small lesions on plant, 2= multiple small lesions on plant, 3= multiple medium-sized lesions on plant, 4= lesions coalescing, plant dying from leaf dieback.

Severity of IYS disease

0% 2% 4% 6% 8% 10% 12% 14%

Untreated control Insecticide program

Percent marketable bulbs with decay

a b

Figure 5: Percent marketable bulbs with internal decay at harvest. A subsample of marketable bulbs (‘Standard’ and ‘Jumbo’ size grades) were longitudinally cut open at harvest to determine if the bulb was decaying. Insecticide applications were applied using an action threshold of one thrips larvae per leaf, and untreated controls were never applied with insecticide.

slide-4
SLIDE 4

0% 2% 4% 6% 8% 10% 12% 14%

0 lbs. N/A 60 lbs. N/A 75 lbs. N/A 105 lbs. N/A135 lbs. N/A Total Percent marketable bulbs with internal decay during the growing season

Bradley Avalon

A.

0% 2% 4% 6% 8% 10% 12% 14%

0 lbs. N/A 60 lbs. N/A 75 lbs. N/A 105 lbs. N/A135 lbs. N/A Total percent marketable bulbs with internal decay at harvest

Bradley Avalon

B.

Management considerations:

1) Use an action threshold to manage onion thrips. In 2015 and 2016, onion thrips were effectively controlled with an action threshold-based insecticide program. In both years and most cultivars, insecticide programs using an action threshold provided the same level of thrips control as compared to a standard (weekly) insecticide program. There were no differences in marketable yield between the action-threshold based insecticide program and standard insecticide program. Additionally, Iris yellow spot disease was reduced using an action-threshold based insecticide program, and provided the same reduction in disease as a standard insecticide program. 2) Consider reducing rate of nitrogen on ‘muck’ soil types. In the three years we have conducted nitrogen trials on ‘muck’ soil, yield has not increased with increasing rates of nitrogen. In 2015 and 2016, yields between nitrogen rates (60, 90, and 125 lb. N/A at planting) were statistically similar to one

  • another. Again, in 2017, the same trend was reported and there were no significant differences in

marketable yield between nitrogen rates (60 lbs. N/A at planting, 60 lbs. N/A at planting + 15 lbs. N/A when onions had 4-5 leaves, 60 lbs. N/A at planting + 45 lbs. N/A when onions had 4-5 leaves, and 60

  • lbs. N/A at planting + 75 lbs. N/A when onions had 4-5 leaves). There was only a significant decrease in

yield in plots that had not received any nitrogen fertilizer. Furthermore, we observed a numerical increase in the incidence of bacterial rot with higher nitrogen rates; however, the effect was only significant between unfertilized onions and fertilized onions. 3) Consider onion cultivar. From the three years of data we have collected, ‘Avalon’ appears to be susceptible to bacterial rots, but has low seasonal numbers of onion thrips. ‘Bradley’ in contrast has had low levels of rot, and higher onion thrips densities. Therefore, careful consideration is needed when planting these onion cultivars, as they may alter management practices.

References: Dut utta, B., Barman, n, A. K., Sriniv nivasan, n, R., Avc vci, i, U., Ull llman, n, D. E., Lang ngston, n, D. B., and nd Git itait itis is, R. D. 2014. Transmission of Pantoea ananatis and P. agglomerans, causal agents of center rot

  • f onion (Allium cepa), by onion thrips (Thrips tabaci) through feces. Phytopathology 104:812-819. Gent

nt, D. H. H., L. L.J. du u Toit it, S. F.

  • F. Fic

Ficht htner, S. K. Mohan, n, H.

  • H. R. Pappu,

pu, and nd H.

  • H. F.
  • F. Schwartz. 2006. Iris

yellow spot virus: An Emerging Threat to Onion Bulb and Seed Production. Plant Dis (90:12): 1468-1480 She helt lton, n, A. M., J.-Z.

  • Z. Zh

Zhao,

  • , B. A. Nault

ult, J. Plate, F.

  • F. R. Musser, and

nd E. Larent ntzaki

  • ki. 2006. Patterns
  • f Insecticide Resistance in Onion Thrips (Thysanoptera: Thripidae) in Onion Fields in New York. J. Econ. Entomol. 99: 1798–1804.

This is resear arch was as fu funded in in par art by y NE-SARE RE, grad aduate te stu tudent t gran ant t GNE16-126. 126.

Figure 6: Total percent onions with bacterial rot symptoms during the growing season (a) and at harvest (b) within differing rates of nitrogen (0, 60, 75, 105, and 135 lbs. of N per acre) and two onion cultivars, ‘Avalon’ and ‘Bradley’. During the growing season (a), plots were examined for bacterial rot symptoms at two points during the growing season, 29 Jul 2017 and 16 Aug 2017. Insecticides were applied after the initial observation on 29 Jul 2017, thus only the untreated control was examined for bacterial rot symptoms. At harvest (b), a subsample of marketable bulbs (‘Standard’ and ‘Jumbo’ size grades) were longitudinally cut open at harvest to determine if the bulb was decaying. Nitrogen applications and rates were split into two times. All fertilized treatments received 60 lbs. of urea at planting, and a split application of either 15 lbs., 45 lbs., or 75 lbs., was applied when

  • nions had between 3-5 leaves. An unfertilized treatment that received 0 lbs. urea was included a control.

Nitrogen rate Nitrogen rate