
SLIDE 1
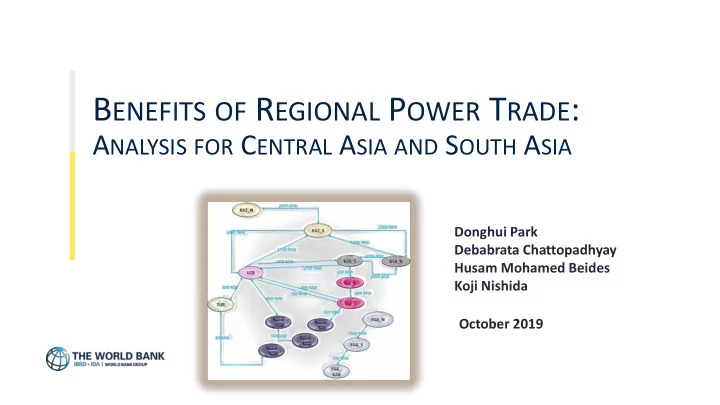
BENEFITS OF REGIONAL POWER TRADE:
ANALYSIS FOR CENTRAL ASIA AND SOUTH ASIA
October 2019 Donghui Park Debabrata Chattopadhyay Husam Mohamed Beides Koji Nishida
B ENEFITS OF R EGIONAL P OWER T RADE : A NALYSIS FOR C ENTRAL A SIA - - PowerPoint PPT Presentation
B ENEFITS OF R EGIONAL P OWER T RADE : A NALYSIS FOR C ENTRAL A SIA AND S OUTH A SIA Donghui Park Debabrata Chattopadhyay Husam Mohamed Beides Koji Nishida October 2019 O BJECTIVE AND S COPE OF W ORK Review and assess country energy demand
October 2019 Donghui Park Debabrata Chattopadhyay Husam Mohamed Beides Koji Nishida
2
3
within Central Asia
interconnection capacity
economic dispatch and regional network management and planning
KGZ, UZB) – to be expanded with TAJ and potential with AFG
Asia and South Asia
4
1. Significant interconnection capacity exists within Central Asia that can be utilized to use surplus hydro in Tajikistan (TAJ) and Kyrgyzstan (KGZ) to support its neighbors 2. Yet total trade volume in the region has been at best 2.5% of regional demand 3. Energy rich Central Asia (Hydro in KGZ and TAJ, Coal in KAZ, Gas in KAZ and TUR, UZB) can support energy poor South Asia with the largest demand center in Pakistan and high demand growth expected in Afghanistan 4. Addition of interconnectors such as CASA- 1000 (under construction), TUTAP (under construction) and future ones would encourage further tapping into hydro and RE potential in Central Asia
and operating costs) for all the countries in Central Asia plus Afghanistan and Pakistan over 2018-2030
model for capacity and dispatch analysis
It also considers chronological load curves for representative days for each year, solar/wind hourly profile for these days, spinning reserve requirements and hydro energy constraints
trade for the relevant regions for a range of scenarios as we discuss next
across regions (b) avoided fuel cost (c) avoided unserved energy (if any)
5
6
7
trade allowed among countries.
CASA PPA amounts btw countries imposed – reserve trade allowed btw countries.
TUTAP lines start operation in 2022 – reserve trade allowed btw countries. Total System Cost 2019-30 (NPV)
Cost Delta – difference btw 1 and 2 (Central Asia regional trade benefits) Cost Delta – difference btw 2 and 3 (CASA- 1000 benefits with its PPA amounts imposed) Cost Delta – difference btw 3 and 4 (TUTAP benefits)
1. We first look at benefits of trade at a high level, namely, total benefits that arise from trade within Central Asia vis-à-vis inter-regional trade with South Asia in cumulative NPV terms over 2019-2030, i.e., a small fraction of the life of the interconnection assets 2. The drivers of these benefits, composition of benefits and their time trend and the generation substitution that is the genesis of trade, provide important insights into the specific contributions of regional trade 3. We identify the critical intra-country and cross-border links that are very heavily (up to 100%) utilized that are good candidates for new investments 4. As an important aside – we also note as solar PV costs continue to fall – regional trade would also facilitate rapid expansion of solar generation capacity across the region
8
9
9
✓ Regional Power Trade Scenarios 2019-2030 Accumulated NPV (in 2019 $m) ✓ Cost Delta (cost savings)
2019-2030 accumulated NPV
Capex: $m
28,621 27,385 26,310 26,169
Fixed O&M: $m
15,053 15,142 15,171 15,188
Variable O&M: $m
20,438 20,644 20,585 20,581
Total fuel Costs: $m
54,302 52,889 51,961 51,487
Unmet demand costs: $m
41 45 45 49
Reserve violation: $m
1,895 698 698 711
Total Gross Cost: $m
120,351 116,802 114,770 114,186 2019-2030 accumulated NPV Difference btw 1. and 2. Difference btw 2. and 3. Difference btw 3. and 4.
Capex: $m
1,235 1,075 141
Fixed O&M: $m
Variable O&M: $m
58 4
Total fuel Costs: $m
1,414 928 474
Unmet demand costs: $m
Reserve violation: $m
1,198
Total Cost: $m
3,549 2,032 584 Definition of benefit CA regional trade benefits CASA-1000 benefits TUTAP benefits
Cost Delta – difference btw 1 and 2 Cost Delta – difference btw 2 and 3 Cost Delta – difference btw 3 and 4
MAJOR BENEFIT FROM TRADE WITHIN CENTRAL ASIA ($3.5 billion over the next decade)
Vast majority of the benefits come from capex and fuel cost savings. There is some savings from avoided reserve capacity violation within Central Asia from early years which can be avoided by simply allowing countries to share reserve The fuel cost component is almost entirely attributable to avoided gas based generation costs with gas generation substituted by hydro
1 235 2 311 2 452 (89) (118) (135) (205) (147) (143) 1 414 2 341 2 815 (4) (4) (8) 1 198 1 198 1 184 (1 000)
2 000 3 000 4 000 5 000 6 000 7 000 CA regional trade benefits CA regional + CASA-1000 benefits CA regional + CASA-1000 + TUTAP benefits
$ million
Capex: $m Fixed O&M: $m Variable O&M: $m Total fuel Costs: $m Unmet demand costs: $m Reserve violation: $m 1 791 2 620 3 242
26 (109) (94) (166) (268) (229) (293)
6 (1 000) (500)
1 000 1 500 2 000 2 500 3 000 3 500 CA regional trade benefits CA regional + CASA-1000 benefits CA regional + CASA-1000 + TUTAP benefits
$ million
Gas: $m LNG: $m HFO: $m Coal: $m UR: $m
Benefits from Fuel Cost Savings
MAJOR BENEFIT FROM TRADE WITHIN CENTRAL ASIA ($3.5b over the next decade). CASA-1000 adds $2b on top and TUTAP another $0.6b [all benefits in discounted terms]
Plot shows annual undiscounted benefits from Central Asian trade only (i.e., difference between scenarios 1 and 2) Total undiscounted benefit over 2019- 2030 is $6.3 billion Over 2021-2023, significant capex savings occur as regional trade is
Beyond 2022 – fuel cost savings become the dominant form of savings (mostly from gas)
In 2019 – capacity reserve trading violations occur in some countries that could be avoided through regional trade even keeping within historical trade limits
200 400 600 800 1 000 2019 2020 2021 2022 2023 2024 2025 2026 2027 2028 2029 2030
$ million
Capex: $m Fixed O&M: $m Variable O&M: $m Total fuel Costs: $m Unmet demand costs: $m Reserve violation: $m
12
There are significant transmission expansion opportunities within Tajikistan, from Tajikistan to Uzbekistan, Uzbekistan to Afghanistan and Tajikistan to Pakistan
Utilizatio n % 2017 2018 2019 2020 2021 2022 2023 2024 2025 2026 2027 2028 2029 2030
TAJ_S PAK_N
91% 89% 89% 89% 88% 88% 88% 88% 88%
TAJ_S TAJ_N
100% 100% 100% 100% 100% 100% 100% 100% 100% 95% 94% 95% 100% 100%
TAJ_S UZB
98% 100% 100% 100% 100% 98% 97% 100% 99%
TAJ_S AFG_TAJ
35% 38% 40% 44% 44% 41% 48% 56% 64% 72% 74% 77% 79% 81%
UZB AFG_UZB
43% 43% 43% 43% 20% 88% 70% 82% 81% 82% 85% 88% 85% 85%
UZB TUR
77% 75% 77% 77% 77% 77% 77% 77% 77%
KAZ_N KAZ_S
74% 77% 81% 78% 74% 78% 74% 41% 47% 53% 46% 40% 35% 36%
a total system cost over 2019-2030 of $119 billion and a generation capital expenditure of $29 billion
interconnections followed by linkages between Central and South Asia.
through better exploitation of hydro plants especially in KGZ and TAJ, shared planning reserve margin, and fuel cost savings due to the shift from gas to hydro
Pakistan and Afghanistan; furthermore TUTAP adds another $0.6 billion on top in benefits
Uzbekistan, Uzbekistan to Afghanistan and Tajikistan to Pakistan
13