
SLIDE 1
ISAPP 2019 R.Mussa, Interdisciplinary science in PAO 1
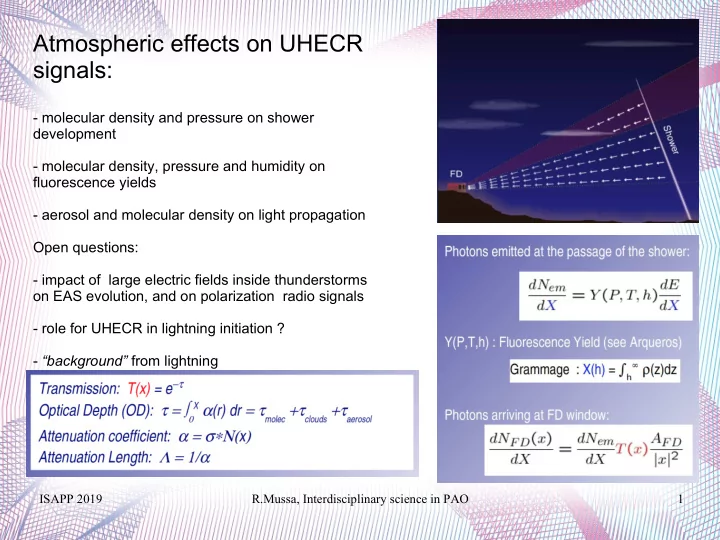
Atmospheric effects on UHECR signals:
- molecular density and pressure on shower
development
- molecular density, pressure and humidity on
fluorescence yields
- aerosol and molecular density on light propagation
Open questions:
- impact of large electric fields inside thunderstorms
- n EAS evolution, and on polarization radio signals
- role for UHECR in lightning initiation ?
- “background” from lightning