Assignments Checkpoint 6 Tone Reproduction Due Monday Another - - PDF document

assignments
SMART_READER_LITE
LIVE PREVIEW

Assignments Checkpoint 6 Tone Reproduction Due Monday Another - - PDF document

Assignments Checkpoint 6 Tone Reproduction Due Monday Another extrashadow ray Checkpoint 7 To be given Monday RenderMan Due February 16th Projects Logistics Project feedback Final Report Approx


slide-1
SLIDE 1

1

Tone Reproduction

Assignments

  • Checkpoint 6

– Due Monday – Another extra…shadow ray

  • Checkpoint 7

– To be given Monday

  • RenderMan

– Due February 16th

Projects

  • Project feedback
  • Approx 18 projects
  • Listing of projects now on Web
  • Presentation schedule

– Just Feb 16th and Feb 21st – Feb 14th – project preparation day

  • ALL PROJECTS HAVE BEEN SCHEDULED

Logistics

  • Final Report

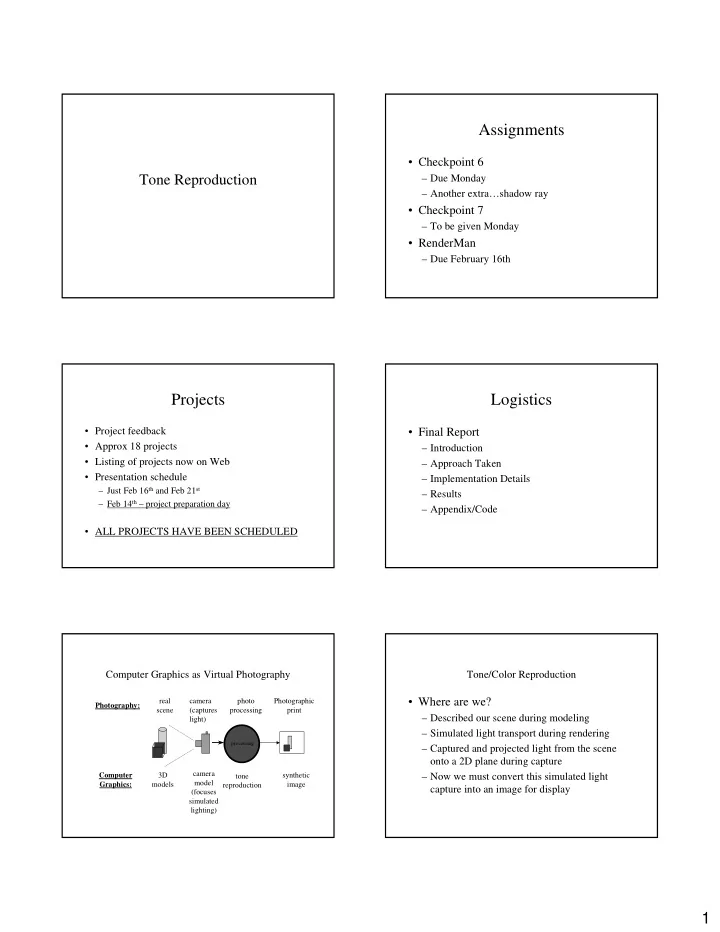
– Introduction – Approach Taken – Implementation Details – Results – Appendix/Code Computer Graphics as Virtual Photography

camera (captures light) synthetic image camera model (focuses simulated lighting)

processing

photo processing tone reproduction real scene 3D models Photography: Computer Graphics: Photographic print

Tone/Color Reproduction

  • Where are we?

– Described our scene during modeling – Simulated light transport during rendering – Captured and projected light from the scene

  • nto a 2D plane during capture

– Now we must convert this simulated light capture into an image for display

slide-2
SLIDE 2

2

Tone Reproduction

  • Luminance levels

Sky = 12400 nits Trees = 64 nits

Traditional Photography

camera

processing

photo processing real scene Photographic print Photography:

Reinterpretation of scene optimized for viewing

Digital Photography

camera

processing

Processing performed by camera real scene Digital image Photography:

Reinterpretation of scene optimized for viewing (24 bit RGB)

Digital Photography

  • Issues

–Tone Reproduction is “hard coded” into camera –Color Management Issues

  • Which RGB?
  • Optimized for what display?

Image Synthesis in CG

camera synthetic image camera model

processing

photo processing tone reproduction real scene 3D models Photographic print Photography: Computer Graphics:

Reinterpretation of scene

  • ptimized for viewing

(24 bit RGB) Scene luminance

Tone Reproduction

Definition: Compressing the dynamic range

  • f a scene’s luminances/radiances so that it

can be displayed on a given device in such a way that minimizes the perceptual difference between viewing the scene and viewing the rendering of the scene.

slide-3
SLIDE 3

3

What if we ignore tone Reproduction?

  • Simple Linear tone reproduction

Light source = firefly Light source = Searchlight

[Tumblin93]

Tone Reproduction - Definition

  • Dealing with luminances / radiances
  • Rendering will be displayed on a given

device

  • Minimize perceptual difference between

real and created.

Tone Reproduction

  • Radiance / Luminance

– Flux arriving at or leaving from a given point or surface in a given direction. – Radiance measured in W / m2 /sr – Luminance measured in cd/m2 (nit) dA

Tone Reproduction

  • Using 0 – 1 to indicate light intensity

– What does 1 mean?

  • CG tends to use intensity space of output

device

  • Images optimized for a given output device.

Why Tone Reproduction?

  • Human response to light is neither simple

nor linear.

  • Most display devices are not linear
  • Incorrect response modeling results in

incorrect perception of results.

The Tone Reproduction Problem

  • What operator will create a close match between real-

world and display brightness sensation? [Tumblin93]

slide-4
SLIDE 4

4

Tone Reproduction in CG

[Ferwerda 1998]

Tone / Color Reproduction

  • Response / Observer

– How does a system (like the human visual system or photography) respond to the collected light?

  • Display

– How do we translate that response using a particular output device (like a CRT or printer)?

Response Models

  • Applying observer/response model will result

in the luminances as seen by your display

  • bserver.

– i.e., will be in luminance range of your output device.

  • Observer/Response Models

– Human Visual System – Photographic Systems

Response Models

  • Image Characteristics

– Spectral response - how system responds to different wavelengths of light – Intensity response - how system responds to different intensities of light – Acuity - the sharpness of the image produced by the system – Noise – inherent noise in the image produced by the system

Human Visual Response Human Visual Response

  • Pupil

– Regulates the amount of light that gets to the retina

  • Photoreceptors

– Rods

  • 75 - 150 million
  • sensitive to 10-6 to 102 cd/m2 (low light levels)
  • Achromatic (detects “brightness”)

– Cones

  • 6 - 7 million
  • sensitive to 0.01 to 108 cd/m2 (high light levels)
  • Responsible for color vision
slide-5
SLIDE 5

5

Human Visual Response

  • Levels of Brightness Response

– Scotopic (Primarily rods)

  • 10-6 to 102 cd/m2

– Photopic (Primarily cones)

  • 0.01 to 108 cd/m2

– Mesopic (overlap!)

  • 0.01 to 102 cd/m2
  • Both rods and cones
  • Little known -- active area of research

Human Visual Response

  • Spectral response

– Human Visual System is sensitive to light in the wavelength range of approx. 350 - 700 nm. – Sensitivity changes dependent on illumination level

Human Visual Response

  • Changes in Spectral Sensitivity

Scotopic Mesotopic Photopic

[Ferwerda96]

Human Visual System

  • Acuity

– Ability to resolve spatial detail

  • Snellen Chart

– View from 20 ft away – Line 8 subtends 1 min

  • f visual angle

– People who can read this is said to have 20/20 vision

[Ferwerda96]

Human Visual System

  • Acuity also changes dependent on luminance

level

[Ferwerda96]

Human Visual System

  • Response at different illumination levels

[Ferwerda96]

slide-6
SLIDE 6

6

Human Visual System

  • Adaptation

– Our vision system has the ability to adapt to a given luminance level – Light Adaptation - from darkness to light – Dark Adaptation - from brightness to dark – Adaptation is gradual, not immediate (and is subject to age! )

Human Visual System

  • Threshold Studies

– determine the threshold at which a person can notice the change between a light sample given a certain background luminance.

Human Visual System

  • Time course for light adaptation

For rods For cones

[Ferwerda96]

Human Visual System

  • Time course of light adaptation

[Ferwerda96]

Human Visual System

  • Time course of dark adaptation

[Ferwerda96]

Human Visual System

  • Time course of dark adaptation

[Ferwerda96]

slide-7
SLIDE 7

7

Human Visual System

  • Ferwerda’s model

– Scales luminances as to preserve perceived contrast using psychophysical data as a guide.

  • Lw = mLd

– Different models for scotopic and photopic vision with slider to blend the two to simulate mesopic vision.

  • m will vary dependent upon whether scene is in

scotopic, photopic, or mesopic range.

  • Greg Ward offers a simpler

approach in Graphics Gems, IV

Ward Tone Reproduction

Original Tumblin-Rushmeier operator

  • Based on “brightness”, a perceptual

measure of how bright humans perceive light.

“Normal” Linear Mapping

[Graphics Gems, IV]

Tumblin-Rushmeier Operator

[Graphics Gems, IV]

Ward Operator Results

[Graphics Gems, IV]

slide-8
SLIDE 8

8

Human Visual System

  • A good overview of CG tone reproduction operators is

available from

– “Tone Reproduction and Physically Based Spectral Rendering” by Devlin et al., State of the Art Report, EUROGRAPHICS 2002.

  • Note that Tone Reproduction operators are now starting to

run in real time using GPU.

  • Questions? Break.

Photographic Response

  • Print photography process

Camera Film

Process Process Negative

Print Paper Printer

[Geigel97]

Optics Photographic Material Processed Photographic Material

Photographic Materials

  • Comprised of microscopic grains of silver

halide in a gelatin (emulsion)

  • Latent image formed when exposed to light
  • Silver halide converted to metallic silver

during processing.

  • Converted silver results in opacity

Photographic Response

  • Illumination Response - high level response
  • f an emulsion to light
  • Spectral Sensitivity - Response of a material

to different wavelengths of light

  • Acuity - Level at which material can

reproduce spatial details

  • Graininess - Observed variation due to grain

distribution

Photographic Response

  • Sensitometry

– The science of measuring the sensitivity of photographic materials – Each characteristic has its own unique sensitometric measure.

Photographic Response

  • A typical brightness response / characteristic curve

Log Exposure D e n s i t y

I II III IV I - toe II - straight line section III - shoulder IV - area of solarization γ - gamma

γ

[Geigel97]

slide-9
SLIDE 9

9

Photographic Response

gamma - slope of region II gives contrast range speed - indicates sensitivity to light S

1 2 3

  • 2

2

γ

1 2 3

  • 2

2

Photographic Response Effects of film Speed

Original 100 Speed Film 400 Speed Film 800 Speed Film

[Geigel97]

Photographic Response - Gamma

Original Low Contrast Medium Contrast High Contrast

[Geigel97]

Photographic Response Spectral Response for Three Types of Film

100

panchromatic

100

  • rthochromatic

100

300 400 500 600

blue sensitive

(Entire visible spectrum) (Blue/Green sensitive) (Untreated- blue/ultraviolet)

[Geigel97]

Photographic Response Effects of Spectral Sensitivity

Original Panchromatic Blue Sensitive [Geigel97]

Photographic Response - Grain

∆Di = deviation of sample

i from the mean

rms deviation: A = area of scanning

aperture

Selwyn Granularity:

G = (2A) σ

Indication of sample uniformity Measure of granularity

σ

1 NΣ(∆Di) 2 = 2

slide-10
SLIDE 10

10

Photographic Response - Grain

[Geigel97]

Photographic Response – Acuity (Resolution)

modulation transfer function point spread function

20 40 60 80 100 40 80 120 spatial freq. (cycles/mm) (%)

Photographic Response - Acuity

Without MTF With MTF With MTF & Grain [Geigel97]

Photographic Response

  • Observer model can mimic response of

photographic systems

– Reinhard – model based on photographic response and photographic techniques – Geigel – general model on simulating response

  • f media to light.

Display Models

  • Need to determine the control values (RGB)

needed to produce luminances calculated by

  • bserver models

Display Models

  • Two Problems to be addressed by display

models

– Gamma

  • Luminances from observer model are on a linear
  • scale. Most display devices are non linear

– Gamut

  • Chromaticities calculated by observer model may

not be reproducible on a given device due to a limited color gamut.

slide-11
SLIDE 11

11

Display Models

– Luminances from observer model are based on a linear scale. – Most display devices are non linear.

Display Models

  • CRTs respond non-linearly to voltage
  • This non-linearity is described by gamma
  • where

– Ld is the actual display luminance – Ldmax is the maximum display luminance – V is the voltage [0,1]

γ

) (

maxV

L L

d d =

Display Models

  • CRTs are non-linear

Sample input to monitor Graph of input Output from monitor Graph of output

Display Models

  • Gamma correction

Sample input to monitor Graph of input Gamma correction Graph of Gamma correction Output from monitor Graph of output

Display Models

  • Most displays/video cards now have gamma

control as part of their OS.

– If we can correct so that gamma is 1.0 then, getting using Ldmax from specs, the voltage V is given by

max d d

L L V =

1/γ

Display Models

  • Gamut

– Range of chromaticities reproducible by a device

slide-12
SLIDE 12

12

Display Models

  • Different Devices have different gamuts

Display Models

  • Perceptual color spaces

– CIELAB – Distances between color values corresponds to difference in perception – Computed from X,Y,Z values and X,Y,Z of a reference white.

Display Models

Handling out of gamut colors

Display Models

  • Display Models must address

– Gamma / non-linearity of device – Gamut

  • Usually dealt with by Color Management

Systems.

Tone Reproduction

  • A final word on Tone Reproduction

– Recall that viewing conditions also affect perception – TR Operator should also make modifications if viewing conditions of world observer does not match that of display observer – Generally included in color management systems but not Tone Reproduction operators.

Tone Reproduction

  • Summary

– Means of compressing dynamic range of scene to fit that of display – Observer / Response Model

  • Human Visual System
  • Photographic Systems

– Device Model

  • Questions?