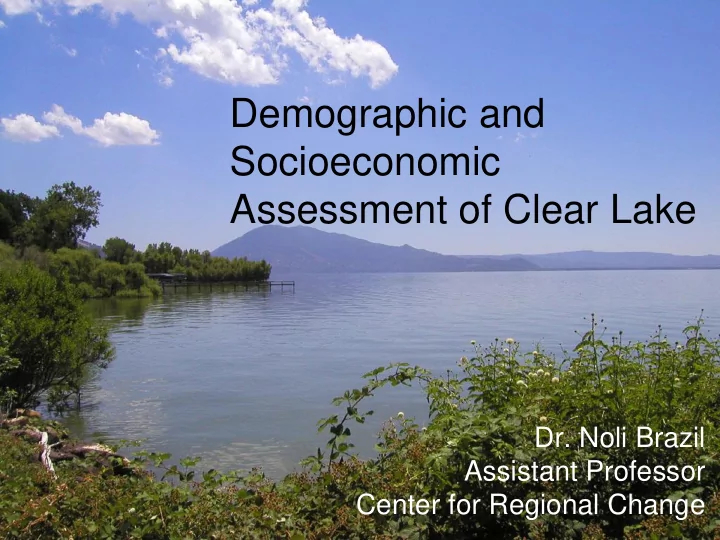

Demographic and Socioeconomic Demographic and Assessment of Clear Lake Socioeconomic Assessment of Clear Lake Dr. Noli Brazil Assistant Professor Center for Regional Change Dr. Noli Brazil Assistant Professor Center for Regional Change
Project Objective and Tasks Identify strategies to improve social and economic outcomes and community vitality. Socio-Economic Analysis 1. Community Economic Development Strategy 2. Community Engagement Strategy 3.
Project Objective and Tasks Identify strategies to improve social and economic outcomes and community vitality. Socio-Economic Analysis 1. Community Economic Development Strategy 2. Community Engagement Strategy 3.
Analytic Framework 1. What does the Clear Lake community look like now? 2. How has the Clear Lake community changed over time? 3. How does the Clear Lake community compare to the broader region? But what is the Clear Lake community ?
Preliminary Analysis 1. Demographic ○ Race/ethnicity, age, residential mobility 2. Housing ○ Renter and homeowner characteristics 3. Socioeconomic ○ Income, education, unemployment 2006-2010 American Community Survey 2013-2017 American Community Survey
Demographic Characteristics: Race/Ethnicity, Origin Clear Lake Lake County Bordering Counties 2017 % 2017 % 2017 % % Race/Ethnicity ▼ -8.6 ▼ -4.6 ▼ -6.6 NH White 69.5 71.7 58.1 ▲ 30.7 ▲ 37.1 ▲ 7.9 NH Asian 1.7 1.4 6.2 ▲ 43.7 ▼ -1.3 NH Black 3.3 2.1 0.0 1.6 ▲ 75.4 ▲ 57.9 ▼ -32.7 NH Native 4.4 3.2 0.7 ▲ 28.8 ▲ 19.0 ▲ 10.4 Hispanic 18.9 19.4 29.4 % Nativity ▲ 15.6 ▼ -1.7 ▲ 3.9 Foreign-Born 8.5 8.7 18.7
Demographic Characteristics: Race/Ethnicity, Origin Clear Lake Lake County Bordering Counties 2017 % 2017 % 2017 % % Race/Ethnicity ▼ -8.6 ▼ -4.6 ▼ -6.6 NH White 69.5 71.7 58.1 ▲ 30.7 ▲ 37.1 ▲ 7.9 NH Asian 1.7 1.4 6.2 ▲ 43.7 ▼ -1.3 NH Black 3.3 2.1 0.0 1.6 ▲ 75.4 ▲ 57.9 ▼ -32.7 NH Native 4.4 3.2 0.7 ▲ 28.8 ▲ 19.0 ▲ 10.4 Hispanic 18.9 19.4 29.4 % Nativity ▲ 15.6 ▼ -1.7 ▲ 3.9 Foreign-Born 8.5 8.7 18.7
Demographic Characteristics: Race/Ethnicity, Origin Clear Lake Lake County Bordering Counties 2017 % 2017 % 2017 % % Race/Ethnicity ▼ -8.6 ▼ -4.6 ▼ -6.6 NH White 69.5 71.7 58.1 ▲ 30.7 ▲ 37.1 ▲ 7.9 NH Asian 1.7 1.4 6.2 ▲ 43.7 ▼ -1.3 NH Black 3.3 2.1 0.0 1.6 ▲ 75.4 ▲ 57.9 ▼ -32.7 NH Native 4.4 3.2 0.7 ▲ 28.8 ▲ 19.0 ▲ 10.4 Hispanic 18.9 19.4 29.4 % Nativity ▲ 15.6 ▼ -1.7 ▲ 3.9 Foreign-Born 8.5 8.7 18.7
Demographic Characteristics: Race/Ethnicity, Origin Clear Lake Lake County Bordering Counties 2017 % 2017 % 2017 % % Race/Ethnicity ▼ -8.6 ▼ -4.6 ▼ -6.6 NH White 69.5 71.7 58.1 ▲ 30.7 ▲ 37.1 ▲ 7.9 NH Asian 1.7 1.4 6.2 ▲ 43.7 ▼ -1.3 NH Black 3.3 2.1 0.0 1.6 ▲ 75.4 ▲ 57.9 ▼ -32.7 NH Native 4.4 3.2 0.7 ▲ 28.8 ▲ 19.0 ▲ 10.4 Hispanic 18.9 19.4 29.4 % Nativity ▲ 15.6 ▼ -1.7 ▲ 3.9 Foreign-Born 8.5 8.7 18.7
Housing: Rent and Value Mean Gross Rent (2010 $) 2006-2010 2013-2017 % ▲ 3.1% Clear Lake 824 849 ▼ -3.9% Lake County 845 812 ▲ 4.3% Bordering Counties 983 1,025 Mean Home Value (2010 $) 2006-2010 2013-2017 % ▼ -34.1% Clear Lake 251,152 165,503 ▼ -39.1% Lake County 265,400 161,764 ▼ -18.4% Bordering Counties 402,900 328,979
Socioeconomic characteristics Clear Lake Bordering Lake County counties 2017 10-17 2017 10-17 2017 10-17 Household income (2010 $) 36,886 -2.7% 35,949 -9.0% 53,669 -1.8% % Unemployed 10.3 -3.2 11.2 -0.1 6.6 -1.8 % Educational attainment College 15.3 -1.1 15.3 -1.1 33.4 2.8 No high school 15.4 1.8 15.3 1.6 13.9 -1.8
Percent unemployed 2017
Percent with broadband subscription 2017
Next Steps Finalize analytic framework • Geographic scale • Clear Lake? • Other comparisons? Other “Lake” communities in CA or other western States? • Other dimensions and characteristics • Trading off breadth with depth
Next Steps • Help inform project tasks • Community Economic Development • Community Engagement with Local Native American Tribes • Contribute to local initiatives • All reports and underlying data will be made publicly available
Questions and Comments Noli Brazil University of California, Davis Center for Regional Change nbrazil@ucdavis.edu 530-752-0754 Data support from Carlos Becerra and Andy Garcia
Recommend
More recommend