
SLIDE 1
- Roll Call of Members
- Approval of Minutes
- Update on NJTPA Freight Division
Activities
- Presentations on Analyzing and
Visualizing Critical Supply Chains
- Two-Minute Reports on Freight
Activities from Committee Members
- Next Meeting: October 21, 2020
- Adjournment
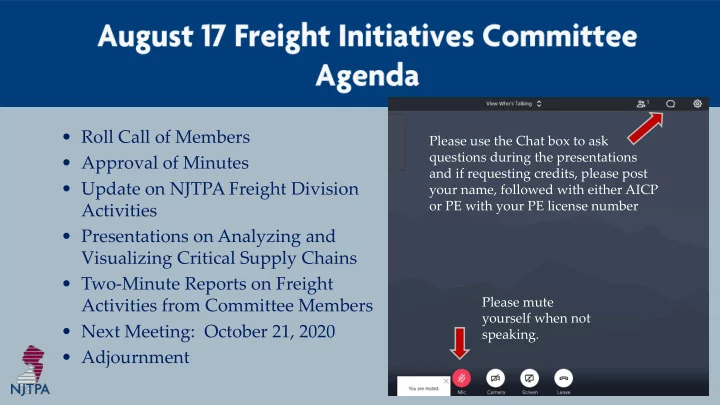
Please mute yourself when not speaking. Please use the Chat box to ask questions during the presentations and if requesting credits, please post your name, followed with either AICP
- r PE with your PE license number