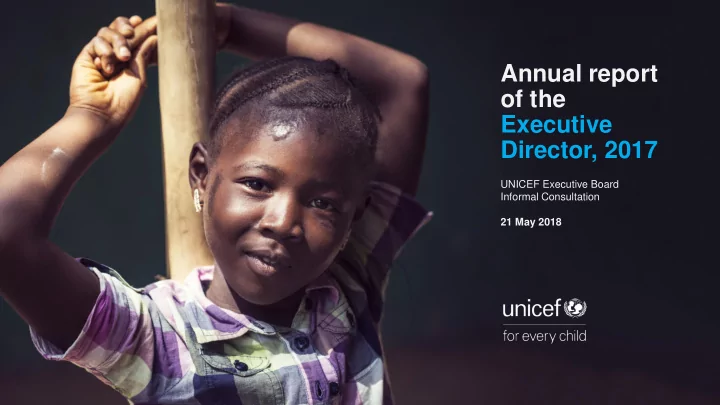

Annual report of the Executive Director, 2017 UNICEF Executive Board Informal Consultation 21 May 2018
Global situation of children & overview of UNICEF results in 2017
Important progress for children The under-5 mortality rate continued its dramatic decline, falling from 46 to 41 deaths per 1,000 live births between 2013 and 2016 Stunting affected 15 million fewer children in 2016 than in 2010 In 2017, 79 per cent of children from the poorest households attended primary school, up from 72 per cent in 2013
250 M 2.6 M primary school-aged children are failing to learn basic literacy newborns died in 2017 and numeracy Around 15 M 155 M adolescent girls (15-19yrs) children under 5 yrs of have experienced forced sex age are stunted in their lifetime.
About 350 million children live in areas affected by conflict - This is a 74-per-cent increase over the past 10 years. - As of 2016, an estimated 28 million children were living in forced displacement.
Highlights of results in 2017 In non-humanitarian situations Over 250 12 million 900,000 12.5 million 15.9 million 3 million 78.6 million million people children children children children more children accessing children received (0-14 years) received registered at immunized reached by safe water vitamin A living with HIV learning birth through against government cash supplementation receiving materials UNICEF measles transfer programs, and other nutrition antiretroviral support in part through interventions treatment UNICEF support
Highlights of results in 2017 In humanitarian situations 9 million 32.7 3 million 8.8 million 3.5 million Over 1 million 18 million people million children children children people children accessed people treated for accessed received vaccinated benefited from adequate provided severe acute formal or non- psychosocial against cash based sanitation adequate malnutrition formal support measles support sanitation education
Output level performance Share of outputs with significant progress, by outcome area, 2017* 100% 100% 100% 100% 90% 83% 83% 83% 80% 67% 70% 60% 50% 40% 30% 20% 10% 0% Health HIV and WASH Nutrition Education Child Social AIDS protection inclusion Outcome area Significant progress for a given output is reported when the average achievement rate of underlying indicators is 60 per cent or higher. See data companion for details on each output.
And on gender equality* UNICEF, with partners, has made substantial progress towards: - ending child marriage, - advancing girls’ secondary education, - promoting gender-responsive adolescent health and - addressing gender-based violence in emergencies. In 2017, 86 per cent of countries included results on at least one of the four targeted Gender Action Plan priorities, up from 75 in 2014. Approved national action plans to address child marriage were in place in 37 countries. With UNICEF support, 60,947 survivors of gender-based violence, both women and girls, accessed safe spaces in Lebanon, and over 10,600 accessed services in Iraq. * more information in the UNICEF GAP report
Strengthened organizational performance
Achievements in organizational efficiency and effectiveness 100% 100% 100% 94% Indiactor achievement rate 90% 83% 80% 70% 60% 50% 40% 30% 20% 10% 0% UNICEF evaluations Gender parity in Country offices Country offices that rated satisfactory on staffing at all levels meeting minimum demonstrate the basis of United operating security efficiency gains Nations standards standards and/or cost savings in programme and operations functions
Widespread use of the Strategic Plan Implementation Strategies UNICEF country offices applying implementation strategies (percentage)
Revenue, expenses, and resource mobilization
Total revenue increased by 27% in 2017, to $6,576 million Regular resources increased by 8%, to $1,423 million Other resources increased by 33%, to $5,153 million. Regular resources as a share of total revenue fell from 25 to 22%
Direct programme assistance by outcome area and resource type 1000 900 Millions of United States dollars 800 700 600 500 400 300 200 100 0 2014 2015 2016 2017 2014 2015 2016 2017 2014 2015 2016 2017 2014 2015 2016 2017 2014 2015 2016 2017 2014 2015 2016 2017 2014 2015 2016 2017 Health HIV and AIDS WASH Nutrition Education Child protection Social inclusion Regular resources Other resources (regular) Other resources (emergency)
Lessons learned 1. More-integrated, multi-sectoral programming 2. Increased focus on adolescence 3. Engaging communities 4. Strengthening national systems
Thank You!
Recommend
More recommend