
SLIDE 1
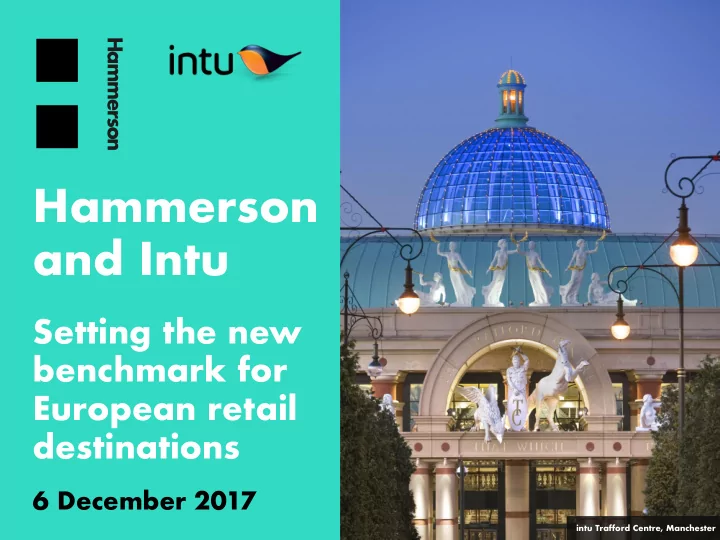
intu Trafford Centre, Manchester
and Intu Setting the new benchmark for European retail - - PowerPoint PPT Presentation
Hammerson and Intu Setting the new benchmark for European retail destinations 6 December 2017 intu Trafford Centre, Manchester Setting the new benchmark for European retail destinations 01 The improved business 02 A leading portfolio 03
intu Trafford Centre, Manchester
Setting the new benchmark for European retail destinations
The improved business
A leading portfolio
Enhanced operating and development platform
Significant financial benefits
Conclusion and Q&A
2
3
Madrid Xanadú, Spain
Apply best practice operating skills to unlock the performance potential of the enlarged portfolio Rigorous income-focused strategy
Creates a pan-European leading portfolio of high-quality retail and leisure property
4
(1) Pro-forma GAV as at 30 Jun 2017, adjusted for Hammerson acquisition of Cergy 3, Paris and disposal of Place des Halles, Strasbourg, and Intu disposal of 50% of Madrid Xanadú and 50% of intu Chapelfield, Norwich
A leading portfolio Compelling financial benefits
Superior combined
Strong development expertise Significant capital recycling opportunities More differentiated destinations Top-three pan-European retail focused REIT with total GAV of £21 billion (1) Increased exposure to higher-growth destination shopping centres Better aligned to meet the needs of retailers in a multichannel world Combining Ireland and Spain, two of Europe’s fastest growing economies Clear rationalisation programme – at least £2 billion of disposals over the short to medium term Reinvest into higher return opportunities – premium outlets, Spain, Ireland and developments Enhanced resources in events, customer service, online and brand Better equipped to drive footfall and dwell time to deliver productive, attractive space for retailers Deploy Hammerson’s expertise in delivering successful developments and extensions across the combined development pipeline Earnings accretion expected
Strengthens Hammerson's consistent earnings and dividend profile
Key transaction terms
(1) Based on Hammerson closing price of 534.5p (2) Includes irrevocable undertakings from Peel Group and associates and Intu Directors , and a letter of intent from Coronation
The offer
All-share offer by Hammerson for Intu of 0.475 new Hammerson shares per Intu share, equivalent to 254p per Intu share (1) Pro-forma ownership Hammerson/Intu 55%/45% Combined group to be listed on LSE and JSE
Leadership and governance
Board of the enlarged group will comprise:
The Board of the enlarged group will comprise six directors nominated by Hammerson and four directors nominated by Intu Expect to have experienced and diverse Board Relationship agreement in place with Peel Group (15% shareholder in enlarged group)
Shareholder support
Conditional on Hammerson and Intu shareholder approval In aggregate, Hammerson has received support from Intu shareholders holding 50.6% (2)
5
6
Puerto Venecia, Spain
Recycle and reinvest into European growth markets More high-quality retail and leisure destinations 18 centres over 1 million sq ft
Attractive portfolio balance
(1) Pro-forma GAV as at 30 Jun 2017, adjusted for Hammerson acquisition of Cergy 3, Paris and disposal of Place des Halles, Strasbourg, and Intu disposal of 50% of Madrid Xanadú and 50% of intu Chapelfield, Norwich (2) Based on annualised NRI for 6 months ending 30 Jun 2017 (3) Darker blue indicating top-10 largest combined group ownerships in UK shopping centres by value
Pro-forma enlarged group, GAV (£bn) (1) Top-3 European retail platform £21 billion GAV (1) £820 million NRI (2) Combining Ireland and Spain, two of Europe’s fastest growing economies Close to 20% higher growth categories of Premium outlets, Spain, Ireland and developments (1)
£0.6bn £0.6bn
UK shopping centres (3) UK retail parks France Ireland Spain Developments & UK other
£0.9bn £13.1bn £1.3bn £2.0bn £2.0bn 7
Premium outlets
8
More relevant to retailers expanding across Europe
Glasgow Dublin Leeds Manchester Bristol Southampton Madrid Paris Marseille Asturias Zaragoza Aberdeen Newcastle Nottingham London Nice Zweibrücken Amsterdam Lisbon Porto Mallorca Zurich Gothenburg Prague Wroclaw Seville Oxford Barcelona Brussels Milan Munich Frankfurt Birmingham Cardiff Intu largest shopping centres Hammerson largest shopping centres Premium outlets (VR and VIA Outlets)
European countries
European cities (1)
top-10 shopping centres create a platform in Spain
8
included as ‘largest’) ‘largest’?
Multichannel
Oslo (1) Oxford Economics Note: largest shopping centres defined as those over 500,000sq ft
9
Bullring, Birmingham
Enhanced operating and development platform
Superior combined
platform More differentiated destinations Strong development expertise Rigorous focus on best brand mix F&B experts Sophisticated commercialisation Harmonised customer services and branding across centres Enhanced events and promotions Complementary digital strategies – affiliate website and bespoke apps Expertise in property development and extensions Enlarged development pipeline Combination drives benefits for retailers, consumers and shareholders
10
11
Rigorous focus on best brand mix
Skinnydip, Brent Cross Smiggle, Dundrum Rituals, Bullring Nespresso, Oracle
Rigorous focus on curating the right retail mix and brand adjacencies Close retailer relationships Leasing informed by dedicated consumer insights team
Future opportunities
Combined leasing expertise with enhanced regional structure intu Braehead and intu Lakeside - curate category clusters and zones intu Metrocentre - reconfigure large spaces and further improve brand adjacencies
Market-leading delivery
12
F&B experts
Mowgli, Grand Central Comptoir Libanais, Oracle Franco Manca, Oracle Bill’s, Westquay
Diversity and innovation in F&B leasing Experienced F&B leasing team. Recent track record at Westquay, Victoria Gate and Silverburn Close relationships with established restaurant brands as well as start-ups
Future opportunities
intu Trafford Centre – trial curated street food intu Merry Hill – review and enhance current F&B offer with extension
Market-leading delivery
13
Sophisticated commercialisation
Beach bar pop-up, Oracle Amazing Chocolate Workshop, Brent Cross Up Market, Bullring Mercedes pop-up, Oracle
Maximise income from pop-ups, digital screens, sponsored events and enhance customer experience Invest in high quality design and fit-out to improve returns Car park investment programme Innovative approach to pop-ups
Future opportunities
Roll out more sponsorship-led events Introduce more regionally-themed events Widen relationship with partners, e.g. AppearHere
Market-leading delivery
14
Complementary digital strategies
Enhanced destinations for consumers
Driving footfall & dwell time, benefitting consumers, retailers and communities
Events Customer service Affiliate online platform B2C branding Sponsorship & promotions Harmonised branding and customer service across centres Enhanced events and promotions Bespoke apps
15
Deploy development expertise
(1) Timeframe 2017-2020
Les Terrasses du Port, Marseille 62,700 sq m 7% YoC Victoria Gate, Leeds 37,500 sq m 6% YoC
–
Strong development track record
Intu development pipeline Additional pipeline, UK and Spain £1.2 billion (1)
intu Lakeside intu Merry Hill intu Watford intu Costa del Sol
Disciplined capital recycling to enhance future growth
16
Rigorous portfolio assessment of enlarged group Asset location Real estate characteristics (e.g. size) Occupier profile Financial performance Multichannel relevance Consumer proposition Identified non-strategic assets At least £2 billion of disposals in short to medium term Enhance growth prospects through reinvestment
Ireland
Reinvestment opportunities across a wide range of higher return growth channels
17
(1) Value Retail sales density CAGR 2007-2016 (2) Retail property rental growth in 2016, according to Capital Economics as of Sep-17 (3) Hammerson’s published forecast ERV growth guidance (4) Total committed development cost for Brent Cross extension, Les 3 Fontaines, Cergy, and Croydon town centre redevelopment
Premium outlets
Sales density growth 11% p.a. (1) ERV growth 4-5% p.a. (3)
0.6 2.0 2012 30-Jun-17 Puerto Venecia 119,000 sq m Dundrum Phase 2 100,000 sq m Dublin Central 5 acres Bicester Village extension 15% YoC
Spain Developments
Brent Cross London 90,000 sq m Les 3 Fontaines, Cergy 33,000 sq m
Hammerson pipeline £1.5bn (4)
Madrid Xanadú 153,000 sq m GAV at Hammerson share (£bn)
€ € €
Market rental growth 5.4% (2)
18
intu Eldon Square, Newcastle
Potential to optimise capital structure and funding
19
(1) Pro forma net debt and LTV as at 30 June 2017, adjusted for Hammerson acquisition of Cergy 3, Paris and disposal of Place des Halles, Strasbourg, and Intu disposal of 50% of Madrid Xanadú and 50% of intu Chapelfield, Norwich
Hammerson financing policies unchanged Maintain solid investment grade credit rating Proceeds from £2 billion disposals used partially to reduce leverage Adapt Intu credit/bank facilities to Hammerson’s cheaper and more flexible unsecured financing structure Proactive approach to refinancing
Ongoing financial strategy Debt ratios (1) Hammerson Intu Combined Net debt
£3.6bn £4.6bn £8.2bn
LTV
37% 45% 41%
Optimising the enlarged group’s financing structure
20
Note: 2018 excludes convertible bonds repurchased since 30 June 2017; 2022 includes additional £250m intu Trafford Centre debt and only 50% of Madrid Xanadú debt; 2024 includes intu Merry Hill refinanced loan
Debt maturity profile at 30 June 2017 (£m)
200 400 600 800 1000 1200 1400 1600 1800 2000
2017 2018 2019 2020 2021 2022 2023 2024 2025 2026 2027- 2031 2032- 2036
Hammerson Intu Selected Intu near-term debt maturities
Selected Intu near-term debt maturities:
Facility Drawn Maturity Convertible bonds £160m 2018 intu Milton Keynes bank loan £140m 2019 CMBS 2019 £20m 2019 Sprucefield bank loan £33m 2020 SGS bank loan £352m 2021 RCF £363m 2021 intu Trafford Centre loan £250m 2022 Convertible bonds £375m 2022 CMBS 2022 £50m 2022 Total £1,743m
21
Approximately £25 million run-rate cost synergies per annum; one-off integration cost of approximately £40 million Opportunity for further cost savings from
Greater confidence in positive LfL NRI growth through enhanced operating platform Earnings accretive in first full financial year Anticipated dividend growth at least in line with Hammerson’s track-record
Strong income profile and superior growth prospects
Bullring, Birmingham Dundrum, Dublin intu Lakeside, Essex intu Trafford Centre, Manchester
22
Indicative timetable
Announcement of transaction
6 December 2017
Hammerson/Intu full-year 2017 results announcement
26 February 2018 / 22 February 2018
Hammerson/Intu shareholder votes
Q2 2018
Expected completion
Q4 2018
23
Puerto Venecia, Spain
Setting the new benchmark for European retail destinations
24
Exciting milestone in Hammerson’s history Enhanced growth prospects More high quality retail destinations Superior retailer proposition Better consumer experience Strong earnings profile and dividend growth
intu Trafford Centre, Manchester Victoria, Leeds
intu Trafford Centre, Manchester
26
27
Hammerson track record of operating performance:
Superior operating platform supports LfL NRI growth
Greater confidence in positive LfL NRI growth
Reported UK shopping centre LfL NRI growth (%)
4.6 2.8 3.2 2.2 2.1 2.4 3.6
1.8 3.6
2 4 6 2011 2012 2013 2014 2015 2016 Hammerson Intu
Reported UK shopping centre occupancy (%)
98 98 96 96
75 80 85 90 95 100 2015 2016 Hammerson Intu
Superior operating platform Implement income focussed process
28
Platform of attractive retail and leisure destinations
intu Trafford Centre, Manchester
183,300 sq m 31m footfall
Bullring, Birmingham
126,900 sq m 35m footfall
intu Lakeside, Essex
133,300 sq m 25m footfall
Zaragoza, Spain
119,000 sq m 19m footfall
Arndale, Manchester
148,600 sq m 42m footfall
Brent Cross, London
85,200 sq m 12m footfall
Dundrum, Dublin
123,800 sq m 18m footfall
intu Eldon Square, Newcastle
125,400 sq m 34m footfall
Les Terrasses du Port, Marseille
62,700 sq m 13m footfall St David’s, Cardiff
intu Metrocentre, Gateshead
195,800 sq m 21m footfall
Bicester Village, Oxfordshire
28,500 sq m 6m footfall
Madrid Xanadú
153,000 sq m 13m footfall
–
29
Top-three European retail REIT
29.5 20.6 17.4 10.4 10.2 7.9 6.6 4.6 5 10 15 20 25 30 35
Unibail Rodamco Hammerson post- transaction Klepierre Hammerson Intu Land Securities British Land Carmila
Notes: Peer retail/shopping centre GAV based on latest reported financials. For Unibail, Klepierre and Carmila, numbers exclude transfer taxes and converted into GBP at exchange rates as of the balance sheet date (1) Pro-forma GAV as of 30 Jun 2017, adjusted for Hammerson acquisition of Cergy 3, Paris and disposal of Place des Halles, Strasbourg (2) Pro-forma GAV as of 30 Jun 2017, adjusted for Intu disposal of 50% of Madrid Xanadú and 50% of intu Chapelfield Norwich
Publicly listed European REITs by retail GAV (£bn)
(1) (2)
30
Highlights of Q3 2017 trading updates
(1) RNS released 9 November 2017. Group figures including UK, France and Ireland shopping centres, and retail parks (2) RNS released 2 November 2017
Hammerson (1) Intu (2) Occupancy 96% Q3 leasing £13million (in line with Q3 2016)
YTD rent reviews 10% above previous passing Footfall +2% vs. Q3 2016; YTD flat vs. 2016 Intu brand net promoter score consistently high at 70 Disposal of 50% intu Chapelfield, Norwich for £148 million (5% NIY); in line with 31 December 2016 book value, small discount to 30 June 2017 book value “Anticipate positive like-for-like net rental income in 2017” Occupancy 97% Q3 leasing £6.8million (+17% vs. Q3 2016)
1% above ERV YTD rent reviews 7% above previous passing UK in-store tenant sales flat; France in-store tenants sales +5.6% Footfall outperformed benchmarks in both UK and France Opening of Bicester Village extension and acquisition of Cergy 3, Paris
31 THIS PRESENTATION AND ITS CONTENTS ARE NOT FOR RELEASE, PUBLICATION OR DISTRIBUTION, IN WHOLE OR IN PART, DIRECTLY OR INDIRECTLY, IN OR INTO OR FROM ANY JURISDICTION WHERE SUCH DISTRIBUTION IS UNLAWFUL.
This presentation has been prepared solely for information and for use in connection with the acquisition by Hammerson plc (“Hammerson") of Intu Properties plc ("Intu"). For the purposes of this notice, "presentation" means this document, any oral presentation and any question and answer session by Hammerson or Intu during the presentations. The release, publication or distribution of this presentation in jurisdictions other than the United Kingdom may be restricted by law and therefore any persons who are subject to the laws of any jurisdiction other than the United Kingdom should inform themselves about and observe any applicable requirements. This presentation is not directed to or intended for distribution to, or use by, any person or entity in any jurisdiction where such distribution, publication, availability or use would be contrary to local laws or regulations or require any registration or licensing within such jurisdiction. Any failure to comply with applicable requirements may constitute a violation of the laws and/or regulations of any such jurisdiction. To the fullest extent permitted by applicable law, Hammerson and Intu disclaim any responsibility or liability for the violation of such requirements by any person. This presentation does not constitute or form part of, and should not be construed as, investment advice or part of any offer, invitation or recommendation to purchase, sell or subscribe for any securities or the solicitation of any vote for approval in any jurisdiction and neither the issue of the information nor anything contained herein shall form the basis of or be relied upon in connection with, or act as an inducement to enter into, any investment activity, or the making of any investment decision. This presentation does not purport to contain all of the information that may be required to evaluate any investment in Hammerson or Intu or any of their securities. Any investment decision should be made solely on the basis of approved formal offer-related documentation to be released in connection with the acquisition, if made. Nothing in this presentation should be construed as constituting legal, business, tax or financial advice and any person considering an investment in Hammerson or Intu is advised to obtain independent advice as to the legal, tax, accounting, financial, credit and other related advice prior to making an investment. The presentation has not been independently verified and no representation or warranty, express or implied, is made or given by or on behalf of Hammerson or Intu or their directors, officers, subsidiaries, shareholders, affiliates, associates, employees, representatives, advisers or any person acting on their behalf ("Associates"), as to, and no reliance should be placed on, the accuracy, completeness or fairness of the information or opinions contained in this presentation and no responsibility or liability is assumed by any such persons for any such information or opinions or for any errors or omissions. Each of Hammerson and Intu and their respective Associates disclaims, to the fullest extent permitted by applicable law and regulation, all and any responsibility or liability whether arising in tort, contract or otherwise, which they might otherwise have in respect of any of the information in this presentation. No duty of care is owed or will be deemed to be owed to you or any other person in respect of the information in this presentation. The information in this presentation is provided as at the date of the presentation, is of a preliminary nature and is subject to change, without notice. Neither Intu nor Hammerson nor any of their respective Associates assumes any obligation to update or correct the information contained in this presentation (whether as a result of new information, future events or otherwise) or to provide you with any additional information, except as required by applicable law. This presentation and any materials distributed in connection with this presentation may contain certain forward-looking statements, beliefs or opinions, with respect to the financial condition, results of operations and business of Hammerson and Intu. These forward-looking statements can be identified by the fact that they do not relate only to historical or current facts. Forward-looking statements often use words such as “anticipate”, “target”, “expect”, “estimate”, “intend”, “plan”, “goal”, “believe”, “hope”, “aims”, “continue”, “will”, “may”, “should”, “would”, “could”, or other words of similar meaning. These statements are based on assumptions and assessments made by Intu, and/or Hammerson, in light of their experience and their perception of historical trends, current conditions, future developments and other factors they believe appropriate. By their nature, forward-looking statements involve risk and uncertainty, because they relate to events and depend on circumstances that will occur in the future and the factors described in the context of such forward-looking statements in this document could cause actual results and developments to differ materially from those expressed in or implied by such forward-looking statements. Although it is believed that the expectations reflected in such forward-looking statements are reasonable, no assurance can be given that such expectations will prove to have been correct and you are therefore cautioned not to place undue reliance on these forward-looking statements which speak only as at the date of this presentation. Quantified financial benefits statements contained in this presentation relate to future actions and circumstances which, by their nature, involve risks, uncertainties and contingencies and which may in some cases be subject to consultation with employees or their representatives. The synergies and cost savings referred to may not be achieved, or may be achieved later or sooner than estimated, or those achieved could be materially different from those estimated. For the purposes of Rule 28 of the City Code on Takeovers and Mergers, the quantified financial benefits statements contained in this presentation are the responsibility of Hammerson and the Hammerson Directors. No statement in this presentation (including any statement of estimated synergies) is intended as a profit forecast or estimate for any period and no statement in this presentation should be interpreted to mean that earnings or earnings per share or dividend per share for Hammerson, Intu or the combined group of Hammerson and Intu, as appropriate, for the current or future financial years would necessarily match or exceed the historical published earnings or earnings per share or dividend per share for Hammerson, Intu or the combined group of Hammerson and Intu as appropriate. To the extent available, the industry, market and competitive position data contained in this presentation have come from official or third party sources. Third party industry publications, studies and surveys generally state that the data contained therein have been obtained from sources believed to be reliable, but that there is no guarantee of the accuracy or completeness of such data. While Hammerson and Intu believe that each of these publications, studies and surveys has been prepared by a reputable source, neither Hammerson nor Intu has independently verified the data contained therein. In addition, certain of the industry, market and competitive position data contained in this presentation are sourced from the internal research and estimates of Hammerson and Intu based on the knowledge and experience of Hammerson and Intu management. While each of Hammerson and Intu believes that such research and estimates are reasonable and reliable, they, and their underlying methodology and assumptions, have not been verified by any independent source for accuracy or completeness and are subject to change without notice. Accordingly, undue reliance should not be placed on any of the industry, market or competitive position data contained in this presentation. You should not base any behaviour in relation to financial instruments