
SLIDE 1
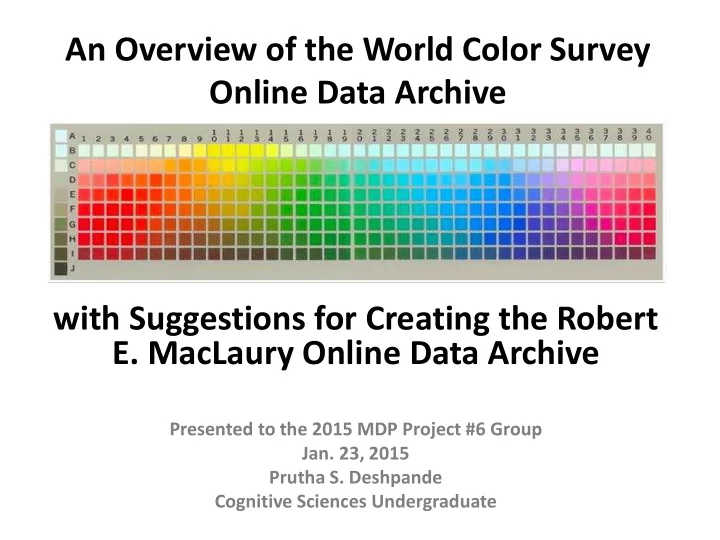
An Overview of the World Color Survey Online Data Archive with Suggestions for Creating the Robert
- E. MacLaury Online Data Archive
Presented to the 2015 MDP Project #6 Group
- Jan. 23, 2015
Prutha S. Deshpande Cognitive Sciences Undergraduate