
SLIDE 1
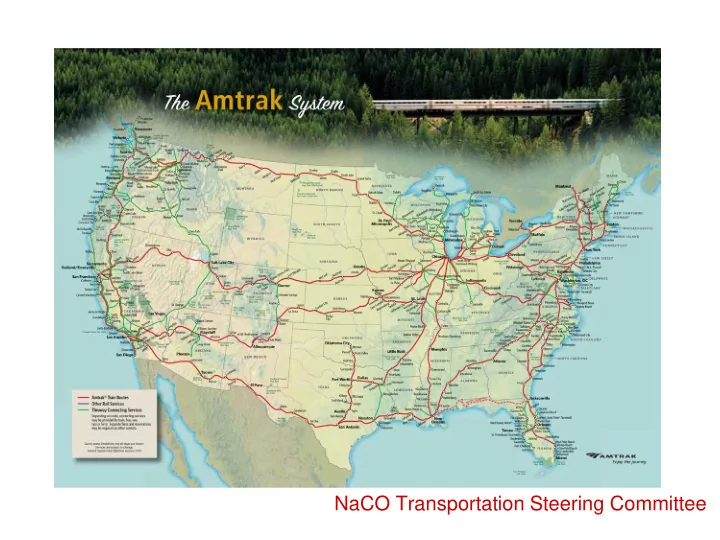
Amtrak: America’s Railroad
NaCO Transportation Steering Committee
Amtrak: Americas Railroad NaCO Transportation Steering Committee - - PowerPoint PPT Presentation
Amtrak: Americas Railroad NaCO Transportation Steering Committee Ridership and Revenues are up Northeast Corridor FY 2012 system ridership a record 31.2M Total Riders 12 9 th such record in 10 years 10 In Millions Record
NaCO Transportation Steering Committee
2
Northeast Corridor
6 8 10 12 1998 2000 2002 2004 2006 2008 2010 2012
In Millions
Fiscal Year
Total Riders
Long Distance Trains
3,000 3,500 4,000 4,500 5,000 1998 1999 2000 2001 2002 2003 2004 2005 2006 2007 2008 2009 2010 2011 2012 In Thousands
Fiscal Year Total Riders
Short Distance Corridors
6 8 10 12 14 16 1998 2000 2002 2004 2006 2008 2010 2012
In Millions
Fiscal Year Total Riders
31.2M
than $2B
46% growth since 1998 Almost 20% growth since 1998 Nearly doubled since 1998
3
We’re tops in the number of passengers per departure – more than twice as many as any of the airlines
Amtrak and the Airlines, Ranked by Total Ridership
20,000,000 40,000,000 60,000,000 80,000,000 100,000,000 120,000,000 S
t h w e s t A i r l i n e s D e l t a A m e r i c a n A i r l i n e s U n i t e d A i r L i n e s U S A i r w a y s A m t r a k E x p r e s s j e t A i r l i n e s S k y w e s t A i r l i n e s j e t B l u e A i r w a y s A i r T r a n A i r w a y s A m e r i c a n E a g l e A i r l i n e s A l a s k a A i r l i n e s P i n n a c l e A i r l i n e s F r
t i e r A i r l i n e s R e p u b l i c A i r l i n e s H a w a i i a n A i r l i n e s S p i r i t A i r l i n e s C
t i n e n t a l M e s a A i r l i n e s H
i z
A i r
Carrier
Total Riders
4
Amtrak Operating Funding Level, 2004-Present
$400.00 $500.00 $600.00 $700.00 $800.00 $900.00 $1,000.00 2 4 2 5 2 6 2 7 2 8 2 9 2 1 2 1 1 2 1 2 Fiscal Year Millions of 2012 dollars
5
$1,890 $2,890 $3,720 $3,940 $3,890 $3,800 $3,660 $3,520 $3,300 $3,200 $2,840 $1,989 $1,870 $1,556 $1,423
$1,000 $1,500 $2,000 $2,500 $3,000 $3,500 $4,000 $4,500
1999 2000 2001 2002 2003 2004 2005 2006 2007 2008 2009 2010 2011 2012 2013
Year In millions of dollars
Amtrak Corporate Debt Total indebtedness is less than half of the 2002 level
6
More than half of our trains now reach or exceed 100mph
2,735 2,897 3,447 3,848 4,118 2,271
500 1,000 1,500 2,000 2,500 3,000 3,500 4,000 4,500
A m t r a k A i r C
m u t e r R a i l A u t
e r s
a l T r u c k T r a n s i t B u s
BTU/passenger mile
Comparative Energy Intensities By Mode of Travel
Sources: USDOT, Oak Ridge Nat’l Labs “Transportation Energy Data Book, 31st Ed, 2012”
7
79 cents of every dollar – the best in the nation
revenues raise this to 85 cents of every dollar
performance was even stronger:
– Train operations recovered 81 cents of every dollar (comparison data not yet available) – Ancillary business revenues raised this to 88 cents of every dollar
Amtrak data is fiscal year, other carriers are calendar year Sources: National Transportation Database, 2011, and Amtrak
2.5% 7.7% 11.8% 12.1% 15.4% 16.7% 21.1% 26.3% 29.5% 36.6% 39.5% 40.5% 44.0% 44.9% 46.1% 46.4% 49.0% 49.5% 53.4% 56.3% 56.7% 59.1% 62.3% 79.0% 0.0% 10.0% 20.0% 30.0% 40.0% 50.0% 60.0% 70.0% 80.0% 90.0% A Train SLE RailRunner FrontRunner Music City Star NorthStar Tri-Rail Sounder DART ACE Coaster Metra Alaska RR MBTA Metrolink South Shore MARC Caltrain LIRR VRE SEPTA NJT MNC RR Amtrak Carrier Farebox Recovery
2011 Passenger Rail Cost Recovery
8
Amtrak On-Time Performance by Fiscal Year
20 40 60 80 100 05 06 07 08 09 10 11 12 Fiscal Year Percentage of on-time arrivals
System Short Distance Long Distance
Long Distance OTP has improved 133% since 2006 (when it was at 30%)
9