AMAZONIAN ATMOSPHERIC CO 2 DATA SUGGEST MISSING MOISTURE SENSITIVITY - - PowerPoint PPT Presentation

amazonian atmospheric co 2 data suggest missing moisture
SMART_READER_LITE
LIVE PREVIEW

AMAZONIAN ATMOSPHERIC CO 2 DATA SUGGEST MISSING MOISTURE SENSITIVITY - - PowerPoint PPT Presentation

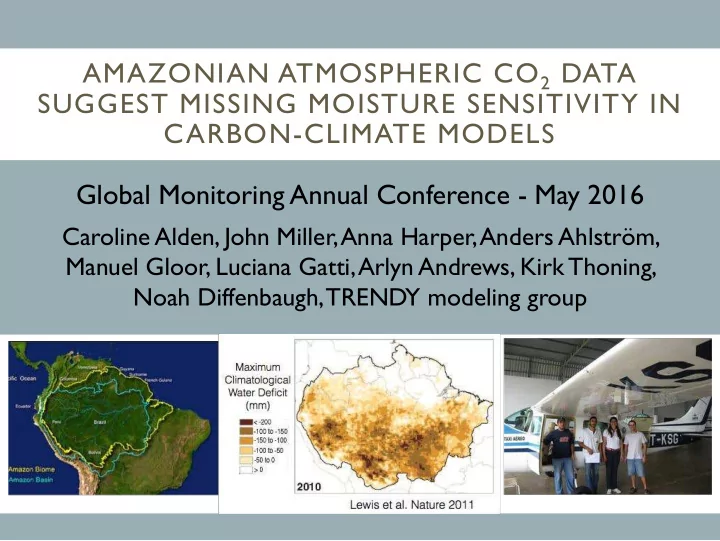
AMAZONIAN ATMOSPHERIC CO 2 DATA SUGGEST MISSING MOISTURE SENSITIVITY IN CARBON-CLIMATE MODELS Global Monitoring Annual Conference - May 2016 Caroline Alden, John Miller, Anna Harper, Anders Ahlstrm, Manuel Gloor, Luciana Gatti, Arlyn Andrews,


slide-1
SLIDE 1

AMAZONIAN ATMOSPHERIC CO2 DATA SUGGEST MISSING MOISTURE SENSITIVITY IN CARBON-CLIMATE MODELS Global Monitoring Annual Conference - May 2016

Caroline Alden, John Miller, Anna Harper, Anders Ahlström, Manuel Gloor, Luciana Gatti, Arlyn Andrews, Kirk Thoning, Noah Diffenbaugh, TRENDY modeling group

slide-2
SLIDE 2

TOP-DOWN & BOTTOM-UP ESTIMATES OF AMAZON NET BIOME EXCHANGE (NBE)

  • TRENDY models: 8 dynamic global vegetation models (DGVMs), S3 simulation

driven by CRU-NCEP reanalysis

  • Regional CO2 inversion: 2010-2012 NBE, largely independent of prior flux

estimates, Aircraft profiles in the Amazon = local CO2 observations 2 Key questions: Agreement in interannual / seasonal NBE? Agreement in NBE sensitivity to moisture and temperature?

slide-3
SLIDE 3

4 Sites over Amazon Basin Flights every 2-3 weeks 10-20 Samples Each Flight from ~300 m to 4400 m 2 “boundary” sites Weekly Sampling

Regional Inverse Modeling

3

slide-4
SLIDE 4

=

Prediction

The inversion adjusts fluxes and background to minimize [Predicted – Observed CO2]

Regional Inverse Modeling

  • Prior NBE estimate is neutral (no seasonal or interannual variability)
  • Background optimized in inversion
  • Transport: 2 Lagrangian particle dispersion models, FLEXPART with

GFS 0.5º and HYSPLIT with GFS 0.5º meteorology

4

20N 20S

x

Background CO2 Prior Flux Footprint

+

ppm

slide-5
SLIDE 5

Annual Basin-wide NBE

2010 NBE 2012 NBE 2011 NBE

Less uptake More uptake

5

Bottom-up Top-down

  • 0.8
  • 0.6
  • 0.4
  • 0.2

0.2 0.4 0.6 0.8 Basin-wide NBE (Pg C yr-1)

2010 2011 2012

slide-6
SLIDE 6

2010 - 2011

Year-to-year differences in Annual Basin-wide NBE

6

  • 0.5
  • 0.3
  • 0.1

0.1 0.3 0.5 0.7 0.9 1.1 1.3

Basin-wide NBE Difference (Pg C yr-1)

2010 - 2012

  • 0.5
  • 0.3
  • 0.1

0.1 0.3 0.5 0.7 0.9 1.1 1.3

Basin-wide NBE Difference (Pg C yr-1)

slide-7
SLIDE 7
  • Inversion NBE seasonality not

consistent year to year

  • Some models appear to have

highly predictable seasonal cycles

Less uptake More uptake

7

Regional NBE Seasonality: Central Amazon

2010 2011 2012

slide-8
SLIDE 8

De-trended mean ± range of 3-year record

— Inversion FLEX — CLM — JULES — LPJ — LPX — ORCHIDEE — OCN — VEGAS — VISIT

Regional NBE Seasonality: Central Amazon

Less uptake More uptake

8

  • Top-down: larger

differences in monthly NBE values from year to year

  • TRENDY: consistent

seasonality from year to year

  • Wet / Dry season

uptake?

Dry Season Dry Season Dry Season Wet Season Wet Season Wet Season

slide-9
SLIDE 9

Alden, Miller, et al. Global Change Biology, 2016 NBE vs. GPCP Precipitation Anomalies NBE vs. NCEP/NCAR Temperature Anomalies

Central Amazon: R = -0.52 Eastern Amazon: R = -0.79 Central Amazon: R = 0.89 Eastern Amazon: R = 0.66

NBE and Climate Anomalies in the wet and dry seasons

12

slide-10
SLIDE 10

Temperature Anomalies Inversion Flexpart CLM JULES LPJ LPX ORCH- IDEE OCN VEGAS

  • C. Amazon wet season lag=0

0.89 0.80 0.88 0.52 0.90 0.80 0.80

  • 0.56
  • E. Amazon wet season lag=0

0.66 0.40 0.84 0.72 0.80 0.83 0.81 0.85

NBE vs. Temperature Anomalies: correlation coefficient R (Bold if p<0.1)

Wet season Temperature Anomalies and NBE

  • Wet season temperature

sensitivity well-represented by most models

13

slide-11
SLIDE 11

Inversion Flexpart CLM JULES LPJ LPX ORCH- IDEE OCN VEGAS

  • C. Amazon wet season lag=0
  • 0.36
  • 0.51
  • 0.52
  • 0.02
  • 0.40
  • 0.57
  • 0.50

0.44

  • E. Amazon wet season lag=0
  • 0.57
  • 0.13
  • 0.44
  • 0.34
  • 0.38
  • 0.36
  • 0.36
  • 0.34
  • C. Amazon wet season lag=1
  • 0.52

0.11

  • 0.10
  • 0.13
  • 0.14

0.05

  • 0.08
  • 0.27
  • E. Amazon wet season lag=1
  • 0.79

0.28

  • 0.09

0.16 0.14

  • 0.13

0.10 0.03

NBE vs. Precipitation Anomalies: correlation coefficient R (Bold if p<0.1)

Wet season Precipitation Anomalies and NBE

  • Wet season 1-month lag

not represented by models

  • Some models capture

precipitation sensitivity without lag

14

slide-12
SLIDE 12

Conclusions

Seasonality of Amazon NBE

  • TRENDY models predict more “predictable” seasonal cycle

than CO2 inversion suggests

  • TRENDY models agree with CO2 observations on dry

season uptake (but for different reasons GPP ↑ Resp.↓) Amazon NBE and Climate Anomalies

  • Wet season NBE temperature sensitivity: TRENDY models

capture signal seen by inversion

  • Wet season NBE precipitation sensitivity: TRENDY models

do not appear to represent observed relationship between precipitation anomalies and NBE in the following month

15

slide-13
SLIDE 13
slide-14
SLIDE 14

14

slide-15
SLIDE 15

15

slide-16
SLIDE 16

De-trended mean ± range of 3-year record

— Inversion FLEX — CLM — JULES — LPJ — LPX — ORCHIDEE — OCN — VEGAS — VISIT

Regional NBE Seasonality: Central Amazon

Less uptake More uptake

8

slide-17
SLIDE 17

9

Regional NBE Seasonality: Central Amazon

CLM VISIT Less uptake More uptake

Respiration (g C m2 day-1) GPP (g C m2 day-1)

2010 total resp. 2011 total resp. 2012 total resp. 2010 GPP 2011 GPP 2012 GPP

Both models: wet season net carbon uptake driven by GPP increase Dry season net uptake: CLM: Respiration decrease, GPP decrease VISIT: Respiration no change, GPP increase

slide-18
SLIDE 18

Mean ± range of 3-year record with each year annual mean subtracted

— Inversion FLEX — CLM — JULES — LPJ — LPX — ORCHIDEE — OCN — VEGAS — VISIT

  • Inversion: wet

season and dry season uptake?

  • Some TRENDY

models show similar signal of wet season uptake

  • Most TRENDY

models show dry season uptake

Regional NBE Seasonality: Central Amazon

Less uptake More uptake

8

Dry Season Wet Season

slide-19
SLIDE 19

Inversion FLEX CLM JULES LPJ LPX ORCHIDEE OCN VEGAS VISIT 2010 total resp. 2011 total resp. 2012 total resp. 2010 GPP 2011 GPP 2012 GPP

Regional NBE Seasonality: Central Amazon

Less uptake More uptake Dry season C uptake:

  • Resp. ↓ GPP ↓
  • Resp. ??? GPP ↑

9

Wet season C uptake:

  • Resp. ↑ GPP ↑
slide-20
SLIDE 20

Mean ± range of 3-year record with each year annual mean subtracted

— CLM — JULES — LPJ — LPX — ORCHIDEE — OCN — VEGAS — VISIT

  • Inversion: wet

season and dry season uptake

  • Few TRENDY

models show similar signal of wet season uptake

  • Most TRENDY

models show dry season uptake Less uptake More uptake

Regional NBE Seasonality: Eastern Amazon

10

— Inversion FLEX

Dry Season Wet Season

?

slide-21
SLIDE 21

Inversion FLEX CLM JULES LPJ LPX ORCHIDEE OCN VEGAS VISIT 2010 total resp. 2011 total resp. 2012 total resp. 2010 GPP 2011 GPP 2012 GPP Dry season C uptake:

  • Resp. ↓ GPP ↓
  • Resp. ??? GPP ↑

Regional NBE Seasonality: Eastern Amazon

Less uptake More uptake

11

slide-22
SLIDE 22

22

Temperature Anomalies Flexpart & NCEP/NCAR R1 CLM JULES LPJ LPX ORCH- IDEE OCN VEGAS

  • C. Amazon wet season lag=0

0.89 0.80 0.88 0.52 0.90 0.80 0.80

  • 0.56
  • E. Amazon wet season lag=0

0.66 0.40 0.84 0.72 0.80 0.83 0.81 0.85

  • C. Amazon wet season lag=1

0.76 0.41 0.53 0.32 0.54 0.56 0.68

  • 0.15
  • E. Amazon wet season lag=1

0.72 0.19 0.64 0.46 0.54 0.53 0.47 0.55

  • C. Amazon dry season lag=0
  • 0.17
  • 0.49
  • 0.18
  • 0.32
  • 0.08

0.51

  • 0.47

0.81

  • E. Amazon dry season lag=0

0.02 0.29 0.10 0.32 0.85 0.60 0.01 0.51

  • C. Amazon dry season lag=1

0.25

  • 0.30
  • 0.16
  • 0.18

0.03

  • 0.21
  • 0.45

0.43

  • E. Amazon dry season lag=1

0.20

  • 0.02
  • 0.15

0.51

  • 0.31

0.11

  • 0.06

0.12

slide-23
SLIDE 23

23

slide-24
SLIDE 24

24

slide-25
SLIDE 25

25

slide-26
SLIDE 26

26

slide-27
SLIDE 27

27

slide-28
SLIDE 28

28

slide-29
SLIDE 29

29