Air Quality Expert Group - Rapid evidence review Air pollution - - PowerPoint PPT Presentation

air quality expert group
SMART_READER_LITE
LIVE PREVIEW

Air Quality Expert Group - Rapid evidence review Air pollution - - PowerPoint PPT Presentation

Air Quality Expert Group - Rapid evidence review Air pollution context and climatology learning from COVID-19 lockdowns Nationwide reduction in transport intensity began mid-March, reached a minimum in The UK has had unusual meteorology in


slide-1
SLIDE 1

Air Quality Expert Group

  • Rapid evidence review

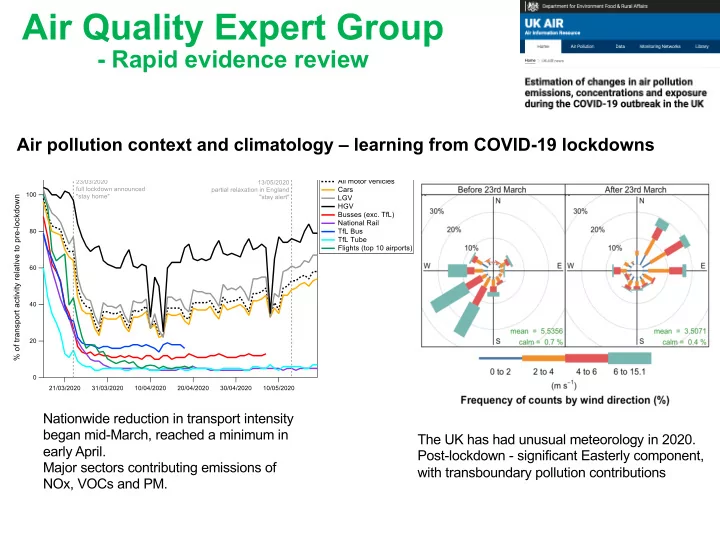
Air pollution context and climatology – learning from COVID-19 lockdowns

Nationwide reduction in transport intensity began mid-March, reached a minimum in early April. Major sectors contributing emissions of NOx, VOCs and PM. The UK has had unusual meteorology in 2020. Post-lockdown - significant Easterly component, with transboundary pollution contributions

slide-2
SLIDE 2

Air Quality Expert Group

  • Rapid evidence review

Significant reductions seen UK-wide in NOx and NO2

Top: Raw data from 225 air quality measurement sites across the UK. Bottom: Same data but corrected to account for meteorological variability

Reproduced from Marner, B., Air Quality Consultants, 2020.

slide-3
SLIDE 3

Air Quality Expert Group

  • Rapid evidence review
  • Compared to 2019, PM2.5 higher during lockdown - due to Easterly weather
  • But using computer models, PM2.5 has been lower in many places compared to a

business-as-usual scenario.

  • Highlights significant AQ influence of wider European emissions.

Reproduced from: Keller C. and Evans, M.J., University of York and NASA Goddard Space Flight Center, 2020.

Business as usual 2020 actual Changes in PM2.5 are more complex to quantify

slide-4
SLIDE 4

Air Quality Expert Group

  • Rapid evidence review

Reproduced from: Williams, M., on behalf of the Environmental Research Group, King’s College London, 2020.

Exposure to pollution depends where you live, work and how you commute

  • Less commuting reduces exposure in London, but could be offset by higher

indoor pollution, for example from additional cooking.

slide-5
SLIDE 5

Air Quality Expert Group

  • Rapid evidence review

Lower NOx emissions in isolation can lead to local increases in ozone

Business as usual 10% lower NOx Lower NOx & VOC Forecasts of a Springtime

  • zone case study under

COVID-19 emissions Forecasts of a summertime

  • zone case study under

COVID-19 emissions 30% lower NOx 50% lower NOx Lower NOx

  • Emphasizes the importance of managing all the key pollutants together with coherent

strategy that recognizes the chemical interconnections

Reproduced from: Agnew, P., et al. Met Office, 2020 and Fakes, L. and Evans, M.J., NCAS / University of York, 2020.