
SLIDE 1
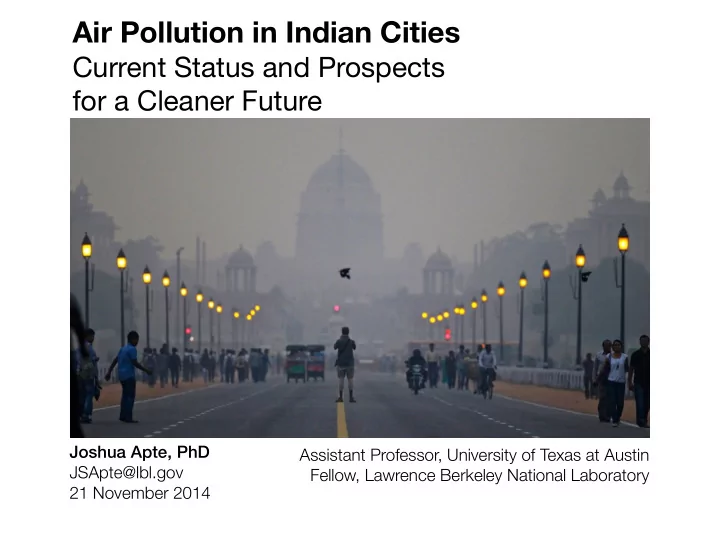
Joshua Apte, PhD JSApte@lbl.gov 21 November 2014
Air Pollution in Indian Cities
Current Status and Prospects for a Cleaner Future
! !
Assistant Professor, University of Texas at Austin Fellow, Lawrence Berkeley National Laboratory
Air Pollution in Indian Cities Current Status and Prospects for a - - PowerPoint PPT Presentation
! Air Pollution in Indian Cities Current Status and Prospects for a Cleaner Future ! Joshua Apte, PhD Assistant Professor, University of Texas at Austin JSApte@lbl.gov Fellow, Lawrence Berkeley National Laboratory 21 November 2014 Outline
Joshua Apte, PhD JSApte@lbl.gov 21 November 2014
! !
Assistant Professor, University of Texas at Austin Fellow, Lawrence Berkeley National Laboratory
pollution crisis
the situation
! !
contribute to solutions
!
pollution?
3 Indian haze from a NASA satellite Delhi’s “fog”, January 2014
4
2/5/2014 Hindustan Times e-Paper http://paper.hindustantimes.com/epaper/viewer.aspx 1/2
5 Source: Global Burden of Disease 2010 Study Lim et al, The Lancet, 2012 Lozano et al, The Lancet, 2012
300k 600k 900k 1.2 M 1.5 M Malaria AIDS Tuberculosis Unimproved water / sanitation High body-mass index Childhood underweight Ambient particulate matter pollution Tobacco smoking Household air pollution from solid fuels High blood pressure Dietary risks Premature Deaths (2010)
1.6 M 1.1 M 1.0 M 1.0 M 630 k 213 k 152 k 137 k 424 k 176 k 48 k
Other selected risks and causes Top 5 risks
Ambient PM2.5 is the #5 risk for death in India
Risk factors for premature death in India
6
the lungs
effects
stroke, respiratory diseases
50-150 µg m-3
Satellite mapping of PM2.5 (Brauer et al, 2012)
7
PM sources include emissions (“primary PM”) and atmospheric formation (“secondary PM”) from precursors
Likely contributes 30-50% of total urban PM2.5
Sources Guttikunda & Calori, Atmos. Env. 2013 Sahu et al., Atmos. Env. 2011
11
AQI PM Statement
Good 0-50 0-12 µg m None Moderate 51-100 12-35 µg m Unusually sensitive people should consider reducing prolonged/heavy exertion Unhealthy for Sensitive Groups 101-150 35-55 µg m Children should reduce prolonged/heavy exertion
12
AQI PM Statement
Unhealthy 151-200 55-150 µg m Children should avoid prolonged/heavy exertion Very Unhealthy 201-300 150-250 µg m Children should avoid all physical activity outdoors Hazardous 301-500 250-500 µg m Children should remain indoors and keep all activity levels low
15
In traffic: in-vehicle exposures Ambient fixed site
How much higher are PM levels in traffic than in ambient air?
Collaborators: IIT-Delhi, UCB, LBNL, UMN | Journal article: Apte et al., Atmos. Environ. 45, 4470-4480, 2011.
16
Ultrafine Particles (UFP) Fine PM (PM2.5) Black Carbon (BC)
Regional pollutant, many sources Marker of traffic pollution Local marker of traffic pollution
17
µg m µg m × 10
Auto- Rickshaw 200 ± 11 43 ± 3.4 290 ± 22 Ambient 140 ± 13 14 ± 1.9 38 ± 3.4 Ratio 1.5 × 3.6 × 8.4 ×
N = 62 trips (~180 h), Feb - May 2010 (Arithmetic mean ± 95% CI)
Ambient air in Delhi is heavily polluted. On-road air is much worse.
Compare PM2.5 data: India annual standard (NAAQS) = 40 µg m -3 US EPA NAAQS = 12 µg m-3 | WHO air quality guideline = 10 µg m-3
18
20 40 60 500 1000 1500 2000 2500
Time (min) PN (1000 cm-3)
Peak ~ 46% On-road ~ 42% Ambient ~ 12%
20 40 60 80 100
PM2.5 BC PN
67% 19% 14% 31% 30% 39% 42% 14% 44%
Fraction of trip-integrated exposure (%)
19 Traffic Impact Zone 500 m from major roads, 50 m from minor roads
Traffic air pollution exposures are elevated in for large populations in the near-roadway zone.
20
Emissions (t/d) Population (millions) Carbon monoxide Sulfur dioxide 1975 42,000 1300 21.5 2010 10,500 300 38.7
Sustainability engineering challenge: reduce PM2.5 levels by 10× {while growing economy + population, addressing climate change} One model: California’s air pollution success story
Data: http://www.arb.ca.gov/ei/emissiondata.htm, via WW Nazaroff
Per capita emissions reduced 7-8× in 35 years
Serious change requires political backing, long-term discipline, dedicated technical capacity and financial resources.
!
facilities and staff, policy design, monitoring networks
21
22
Controlling air pollution can protect health, slow climate change and improve food security
Major air pollution sources are also major CO2 emitters
!
Mandate for Action Health Studies Monitoring Data Scientific Basis Public Awareness
23
HEPA filter
produce harmful ozone
!
+ A/C as needed
!
25
“traditional” global health challenges.
!
technical capacity
sustained investment.
!
26