Agenda 10:00-10:15 Introduction 10:15-11:30 Overview of Soil - - PDF document

agenda
SMART_READER_LITE
LIVE PREVIEW

Agenda 10:00-10:15 Introduction 10:15-11:30 Overview of Soil - - PDF document

Presentation at Ontario MOE Soil Vapour Intrusion Information Session January 27, 2011 Draft Technical Guidance: Soil Vapour Intrusion Assessment, November 2010 Camilo Martinez, P.Geo Ian Hers, P.Eng., Ph.D. and Michael Zgraggen, M.Sc


slide-1
SLIDE 1

Presentation at Ontario MOE Soil Vapour Intrusion Information Session – January 27, 2011 Draft Technical Guidance: Soil Vapour Intrusion Assessment, November 2010

Camilo Martinez, P.Geo Ian Hers, P.Eng., Ph.D. and Michael Z’graggen, M.Sc Community Based Risk Assessment Coordinator Soil Vapour Intrusion Practice Leaders Ministry of the Environment Golder Associates Ltd. Standards Development Branch

.

2

2

Agenda

10:00-10:15 Introduction 10:15-11:30 Overview of Soil Vapour Guidance 11:30-12:00 Questions and Answers

3

3

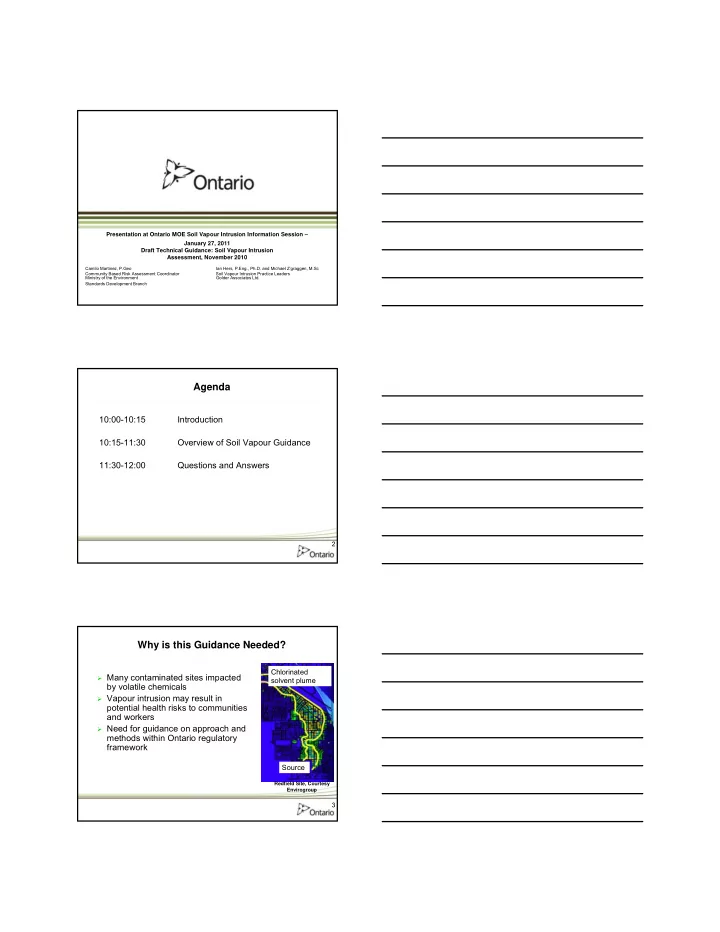
Why is this Guidance Needed?

Many contaminated sites impacted

by volatile chemicals

Vapour intrusion may result in

potential health risks to communities and workers

Need for guidance on approach and

methods within Ontario regulatory framework

Source Chlorinated solvent plume

Redfield Site, Courtesy Envirogroup

slide-2
SLIDE 2

4

4

Guidance Development Process

Golder Associates contracted by MOE to write draft

guidance

Peer review conducted by Geosyntec Consultants Initial consultation and review by a stakeholders

Advisory Group (February 2009)

Additional consultation and review by BILD Reference

Group in December 2010, followed by current broader consultation – comments requested by the end of January.

Stakeholder consultation January 201. Guidance will be posted on the EBR for further

comments.

5

5

Document Outline

Chapter 2 - Overview vapour intrusion assessment process Chapter 3 - Conceptual Site Model (CSM) Chapter 4 - Tiered Screening Process Chapter 5 - Soil Vapour Characterization Chapter 6 - Indoor Air Quality (IAQ) Monitoring Guidance Chapter 7 - Background Assessment Chapter 8 - Reporting and

6

6

Document Outline

Appendix I - Detailed CSM Appendix II - Identification of Contaminants of Potential Concern Appendix III - Selected Analytical Methods Appendix IV - Recommended Health-Based Indoor Air Target Levels for Brownfield sites

slide-3
SLIDE 3

7

7

Soil Vapour Guidance Main Objectives

Promote the understanding of the

behaviour and migration of soil vapours,

Assist identifying sites where VI may be

an issue,

Assist qualified professionals conducting

vapour intrusion assessments and risk assessments, and

Assist MOE staff in conducting reviews.

8

8

Experience Base

► See also Science Advisory Board for Contaminated Sites of BC (SABCS 2006, update January 2011), Cal DTSC 2010, EPRI 2005, API 2005.

USEPA 2002 ATLANTIC PIRI 2006 ITRC 2007 HEALTH CANADA 2008

9

9

Overview of Soil Vapour Intrusion Assessment Process (Chapter 2)

Site characterization and continuous development of

the conceptual site model (CSM)

Tiered or phased assessment process (although not

necessarily sequential)

  • Preliminary screening & comparison to MOE SCS
  • Screening level vapour intrusion assessment – soil

vapour characterization, limited model adjustment

  • Detailed vapour intrusion assessment, further

modelling flexibility and use of site-specific data.

slide-4
SLIDE 4

10

10

Overview of Soil Vapour Intrusion Assessment Process

Multiple lines-of-evidence

approach where appropriate (e.g., different media, models,

  • ther data)

Vapour intrusion mitigation Community outreach

Process Flowchart from Chapter 2

11

11

Conceptual Site Model (Chapter 3)

Fate and transport

processes are described:

  • Diffusion
  • Advection
  • Biodegradation
  • Sorption

Followed by CSM

scenarios of interest

USEPA 2002

12

12

Fresh-water lens (non- contaminated groundwater) infiltration Precipitation Capillary Transition Zone NAPL Source Falling water table apillary Transition Zone NAPL Source

Conceptual Site Model

Scenarios of Interest

  • Fresh-water lens
  • Interface plume
  • Preferential pathways
  • Lateral diffusion
  • Barometric pumping
  • Stack effect
  • Seasonal factors (cold weather)

Fresh water lens Falling water table

Why are CSMs important? – Inform sampling design

slide-5
SLIDE 5

13

13

Conceptual Site Model – Aerobic Biodegradation

Aerobic biodegradation of BTEX and alkane (hexane, octane) vapours is relatively rapid process – supports bioattenuation factors

14

14

Site Screening Process (Chapter 4)

Preliminary screening Screening level vapour intrusion assessment Detailed vapour intrusion assessment

15

15

Preliminary Screening

Are there chemicals of potential concern for vapour

intrusion?

Does site represent safety or acute health risk concern

(e.g., potential explosive conditions, odours)?– If yes take appropriate actions

Are buildings (current or future) located sufficiently close

to contamination?

  • 30 m for non-degrading chemicals
  • 15 m for aerobically biodegradable chemicals*

* Defined in MGRA spreadsheet as BTEX, hexane, naphthalene, and hydrocarbon fractions

slide-6
SLIDE 6

16

16

Generic Screening

Check precluding conditions to determine whether

generic MOE soil and groundwater standards for the soil vapour intrusion pathway can be applied.

Compare soil and/or groundwater concentrations to MOE

standards (S-IA or GW2 component values) for soil and groundwater

If a precluding condition is present or concentrations

exceed MOE S-IA or GW2, further assessment should be considered.

Measured soil and/or groundwater concentrations are compared to MOE standards.

17

17

Precluding or Modifying Conditions

Shallow depth to water table – When < 3 m use MOE Tables 6 & 7 (use attenuation factor equal to 0.02) Very high gas permeability media – Use Tables 6 and 7 Earthen basements - Unless source > 5 m from building Gas under pressure Subsurface utility conduits connecting contamination source and building

18

18

Screening Level Vapour Intrusion (VI) Assessment

Conduct additional site characterization Calculate groundwater and soil vapour

screening levels (GWSLs and SVSLs)

Selected Brownfield target indoor air concentrations are

provided in Appendix IV

Use Modified Generic Risk Assessment (MGRA) Model

  • r peer-reviewed model (e.g., USEPA Superfund J&E

model) following guidelines for input parameter selection

Compare measured groundwater and soil vapour concentrations to screening levels.

slide-7
SLIDE 7

19

19

Screening Level VI Assessment – Site Characterization

Multiple lines of evidence approach introduced (also

essential under detailed risk assessment)

Pro’s and con’s for different media Guidelines for data collection and interpretation are

provided

An overview is provided in Chapter 4 with additional

details in Chapter 5

20

20

Screening Level VI Assessment – Multiple Lines-of-Evidence (MLE)

What is MLE?

  • Testing of different media (soil,

groundwater, soil vapour, air)

  • Sampling at multiple locations
  • Consideration of non-chemical

factors (e.g., geology, building factors, biodegradation)

  • Modeling
  • Data interpretation integrated

with CSM

Subslab Soil Gas Groundwater Outdoor Air Indoor Air Soil Gas

21

21

Screening Level VI Assessment – Multiple Lines-of-Evidence (cont)

Why MLE?

  • Reduce uncertainty
  • Improve assessments
  • Help determine if VI

pathway is complete (i.e., background issue) Caveat: Sampling should be strategic (not all LOE’s may be needed)

Subslab Soil Gas Groundwater Outdoor Air Indoor Air Soil Gas

slide-8
SLIDE 8

22

Pro’s and Con’s Different Media

Media Pro’s Con’s Soil Data typically available, low cost, low temporal variability Partitioning highly uncertain, high spatial variability, may be bias Ground water Data typically available, low cost, moderate temporal variability Partitioning uncertain, not representative if unsaturated zone contamination source External soil vapour Avoids partitioning, more direct indication exposure, may integrate sources Often high spatial variability, shallow data may not be representative Subslab vapour Closer to receptor, avoids lateral variability Intrusive, cost, small scale spatial variability can be high Air Most direct indication (only for existing building) Intrusive, cost, temporal variability moderate to high, background issues

23

23

Screening Level VI Assessment – Soil Data Challenges

  • Dr. John Cherry, Federal

Contaminated Sites National Workshop, May 2010

PCE release experiment Borden site - Vadose zone excavation

24 GOLDER ASSOCIATES

H-009 Sub-Slab Trends TCE 50 100 150 200 250 300

O N D J F M A M J J A S O N

ug/m3

Subslab A Subslab B Subslab C

TCE measured at 3 different locations below house Hydrocarbon Concentrations Below Slab Luo, 2006 ASU 11 DCE Soil Gas Concentrations Dawson, 2005 USEPA TCE Subslab Soil Gas Concentrations Wertz, NYSDEC, 2009

Spatial Data to Illustrate Issues for Soil Vapour Characterization

Casper, WY Soil gas TPH 2’ depth

24

slide-9
SLIDE 9

25

TCE Concentrations in Soil Gas (1.5 m depth) Showing Seasonal Variations McAlary, 2009 TCE Concentrations in Groundwater, Shallow and Deep Soil Gas Wertz, 2007

Temporal Data to Illustrate Issues for Soil Vapour Characterization

Log Scale Log Scale 25

Monthly Sampling Shallow Soil Gas Groundwater Deep Soil Gas

26

Buildings can “breath” both ways! (implications for subslab vapour sampling) Pressure Difference Pressure difference across slab

Temporal Data to Illustrate Issues for Soil Vapour Characterization (Paul Johnson, ASU – Casper, WY)

26

27

3-D Numerical Model (this is a slice through the house)

Abreu & Johnson, ES&T, 2005

Building Vapors

What if you sample out here?

  • V. High gasoline concentrations

Oxygen

Slightly lower gasoline concentrations

Modelling Study (Illustrates spatial

variability and effect of biodegradation)

27

slide-10
SLIDE 10

28 1.E+00 1.E+01 1.E+02 1.E+03 1.E+04 1.E+05 1.E+06 1.E+07 1.E+00 1.E+01 1.E+02 1.E+03 1.E+04 1.E+05 1.E+06 1.E+07 External Soil Vapour (ug/m3) Subslab Soil Vapour (ug/m3)

Comparison Subslab and External Soil Vapour

0‐1 m 1‐2 m 2‐3 m 3‐4 m > 4 m

Vertical Distance Between Subslab and External Soil Vapour

Beside building higher than subslab Subslab higher than beside building

Shallow external soil vapor less reliable indicator than deeper data

Comparison Subslab & External Soil Vapour Data

USEPA and Health Canada database – Chlorinated solvent database 28

29

29

Screening Level VI Assessment – Soil Vapour Sampling Guidelines

Start by characterizing

soil vapours near to source (water table or soil), then move closer to building

Consider vertical profiles

and lateral transects to characterize spatial variability

Starting point are MGRA minimum requirements, but guidance goes further to describe rationale and how to design sampling program

Capillary Transition Zone

30

30

Screening Level VI Assessment – Soil Vapour Sampling Guidelines

For external samples, obtain samples minimum half-way

between building foundation and vapour source, and also meet minimum recommended depth.

When evaluating

building obtain samples on multiple sides of building (due to lateral variability)

2-3 m Min 1/ 2 D Capillary Transition Zone May use soil vapour (provided data is representative) Subslab vapour D

Use model D Use subslab data * Min 1/2D

Recommended minimum depth

* α=0.02 residential, α = 0.004 commercial

Min 1 m

slide-11
SLIDE 11

31

31

Screening Level VI Assessment – Soil Vapour Sampling Guidelines

Greater number of samples needed as complexity and

variability increase, or alternatively alternate approaches (e.g., composite or high purge volume sampling)

Generally minimum of two sampling events required to

address temporal variability

Generally should not obtain samples during or shortly

after heavy rain

32

α = alpha = vapor attenuation factor Alpha = 1/dilution factor

Soil vapor α = Cair/Csoil vapor Subslab α = Cair/Csubslab vapor Groundwater α = Cair/Cvapor Cvapor = Cwater * H’

Attenuation Factor Definition

33

33

33

Screening Level Vapour Intrusion Assessment

Soil texture (U.S.SCS classes in U.S.EPA

J&E spreadsheet excluding clay soil textures)

Distance from building to measurement point Vapour mixing height and building air exchange rate Biodegradation attenuation factor adjustment Building parameters are fixed (MOE defaults

recommended)

As part of GSL & SVSL calculation, following parameters may be adjusted within guidelines provided:

slide-12
SLIDE 12

34

34

Screening Level VI Assessment – Soil Texture Classification

Conduct grain size distribution tests on soil samples Use USDA textural soil triangle to determine soil type Use coarsest grain size (unless analysis is performed

to show use of fine-grained layer

35

35

Screening Level VI Assessment - Bioattenuation Adjustment Factors

36

36

Biodegradation Adjustment

Continuous or near-continuous soil core & field screening (e.g., headspace testing) Careful analysis for whether NAPL

  • r dissolved

source

Distance (API 2005)

slide-13
SLIDE 13

37

37

Biodegradation Adjustment

Obtain soil vapour data (O2, CO2, CH4, Hydrocarbons (HC)) from vertical profiles either below building or paved area beside building to demonstrate bioattenuation

  • ccurring

BAF not applicable if significant capping effect (unless data demonstrates bioattenuation occurring) Ongoing research in-progress focussing on capping and cold climate factors

38

38

Screening Level VI Assessment – Data Evaluation and Next Steps

Are predictions consistent with the CSM and internally consistent for different media and sampling locations? Is the data adequate when the assessment indicates no further action is warranted? What is the overall uncertainty in the assessment and how should this influence decisions made?

39

39

Screening Level VI Assessment – Matrix for Further Actions

When interpreting data consider uncertainty instead of following “bright-line” approach

slide-14
SLIDE 14

40 GOLDER ASSOCIATES

Soil Vapour Sampling (Chapter 5)

41

41

Soil Vapour Sampling and Analysis Procedure

Selection of probe and sampling train materials Test blanks Installation of probes Probe equilibration Flow and vacuum check Leak tracer test Purging and sampling Field screening Collection of samples for laboratory analysis

42

Temporary direct push sampler with retractable screen (Geoprobe

  • r AMS system) – Key is avoiding

leakage

Permanent probes installed in

boreholes or using direct push – Mini-well (19 mm dia rigid PVC, 30 cm long) or Implant (13 mm dia, 15 cm long) – Key is sealing probe

Geoprobe implant

Very small sampling tips not recommended

Soil Vapour Probes

slide-15
SLIDE 15

43

This is why you need helium leak tracer!

44

44

Soil Vapour Sampling and Analysis Considerations

  • Teflon or Nylaflow (except

naphthalene - poor recovery shown in study by Air Toxics)

Vacuum/Lung Box Flow and Vacuum Check Sampling Materials

  • Avoids pump

contamination

  • r leakage
  • Helps check if probe

plugged or leaking, also measure soil-air permeability

45

45

Purging Volume Studies

Three probe volumes adequate (except for vented wells) Emerging approach sample after field parameters have

stabilized

TetraTech (2007) (for USEPA)

TCE Conc (ug/m3) Conc (ug/m3) Volume (litres) System purge volumes

Raymark Site (USEPA, 2006) 3 purge volumes 3 purge volumes

slide-16
SLIDE 16

46

46

Selected Soil Vapour Analytical Methods

Thermal tube (TO-17) Summa canister (TO-15)

Golder EPRI research project

47

Advantages Disadvantages

TO-15 Summa

  • Whole air sample
  • No pump required
  • Good recovery

lighter molecular weight compounds

  • Proper cleaning of canister & flow controller

essential

  • Hardware issues
  • Reduced recovery for naphthalene and

heavier compounds TO-17 Sorbent

  • Easier to clean tube
  • Better recovery

heavier molecular weight compounds

  • Easier to transport
  • Pump required and must confirm flow rates in

field

  • Potential for breakthrough (lab must validate

the sorbent used)

  • Sorbent affected by moisture

Both methods acceptable, but require experienced samplers and laboratory

Comparison of TO-15 and TO-17 Methods

47

48

Passive soil Vapour Flux chambers Building pressure measurements HVAC information (exhaust & make-up air) Building ventilation tracer (CO2, SF6) Building intrusion tracer (radon) Tree coring Mitigation options

Expanded Toolbox and Ancillary Measurements

48

slide-17
SLIDE 17

49

Follow appropriate sampling procedures (materials, leak

testing, purging, sample storage) – Suggested operating procedures (SOPs) are helpful

Establish data quality objectives (DQOs)

  • Detection limits, data accuracy and precision, holding

times, etc.

Testing and certification that sampling device is clean Test field quality control samples (duplicates, blanks, trip

blanks where appropriate)

Obtain other QC data (vacuums, flows, etc.)

QA/QC Program is Essential!

49

50

50

Detailed VI Assessment

Indoor air, outdoor air and often

subslab vapour testing is conducted

May use different models or input parameters compared

to screening VI assessment, but typically may not screen

  • ut sites based on modeling alone

Typically consists of indoor air quality testing (and other complementary data) and may include modeling

51

51

Indoor Air Quality Testing – Planning (Chapter 6)

Define study objectives (screening, detailed, monitoring) Identify target compounds Pre-sampling building questionnaire/survey (PIRI, ITRC) Communication with building occupants Access agreement Study objectives Scheduling, activities to avoid Consider removing products Can conduct preliminary screening (recognize limitation)

slide-18
SLIDE 18

52

52

Indoor Air Quality Testing - Design

Indoor air, outdoor air and often subslab vapour tested Typically test under normal building conditions Number of samples depends on building characteristics

(some guidelines provided in Guidance), consider both exposure and pathway samples

When multiple buildings are impacted modeling may be

used to prioritize sampling

Typically will require two or more monitoring events

under different seasonal and building conditions

53

53

Indoor Air Quality Testing – Short-term Temporal Variability

Subslab Indoor Air About AF ~ 0.008

Membrane Inlet Mass Spectrometer (MIMS) (detection limit 0,5µg/m3)

Danish Research Site Basement Monitoring

54

54

54

Indoor Air Quality Testing – Long-term Temporal Variability

How to address variability?

  • Long-term – repeat sampling
  • Short-term – Passive diffusive

samplers – Guidance includes comprehensive review

3 00 200 5 5 8 7 56 33 100 200 300 400 500 F eb Á p r M áj Jú l A u g S z ep t O k t N

  • v

TCE in Houses in Eastern Europe Golder, 2006

L o w r y A ir F o r c e B a s e , C O

1 0 2 0 3 0 4 0 5 0 6 0 J a n-0 0 A p r-0 0 Jul-0 0 S e p -0 0 D e c-0 0 M a r-0 1 Indoor Air Concentration (ug/m3) U A 0 3 U A 2 2 U A 2 5

1,1 DCE in Houses in Colorado H. Dawson Waterloo Membrane Sampler Radiello Sampler

slide-19
SLIDE 19

55

55

56

56

IAQ Lines-of-Evidence Evaluation (Chapter 7)

Subslab/indoor air ratio - Less than 10 suggests background

source for representative data

Constituent ratios – For chemicals with similar properties

ratios should be similar if VI is occurring

Comparison to literature background Marker chemicals (not generally found in indoor air) Comparison to outdoor air data Compare indoor air under control building pressures (positive

and negative)

Emerging methods – Carbon stable isotope analysis and

radon tracer testing

57

57

Pathway Completeness and Assessment of Background

COMPOUND RATIOS

Groundwater Indoor Air Soil Gas

4.0 2.1 3.0 <1-4.0 9.2

1.7 m

Measured soil vapor or air

Benzene Concentrations

22900

Zone of rapid biodegradation

GOLDER ASSOCI

Deep soil vapour Subslab soil vapour Indoor air

Toluene Benzene 1,3,5 Trimethylbenzene Predicted from groundwater

PATHWAY ANALYSIS

slide-20
SLIDE 20

58

58

Detailed VI Assessment – Data Evaluation and Next Steps

Consider uncertainty, data adequacy and how close the

predicted concentration is to acceptable levels.

When indoor air concentrations exceed acceptable

levels, exposure controls may be warranted, including measures to:

Eliminate or reduce contamination sources; Intercept or control the vapour migration pathway

(e.g., subslab depressurization or venting systems); and/or

Building specific mitigation measures. Recommend contacting the SDB when indoor air

concentrations exceed acceptable levels and when determining appropriate actions.

59

59

Summary

Soil Vapour Intrusion Guidance based on latest science, Clear framework for obtaining quality data, Alternative to the use of conservative models or generic

screening values to assess risks for the VI pathway,

Outlines Ministry expectations for VI studies in support of

a RAs,

Help provide greater consistency in data collection,

analysis and interpretation methods.

Thank You! Questions?

61