
Rutherford County Solid Waste Advisory/ Steering Council
Workshop 2: Technologies and Organization February 27, 2017 Murfreesboro City Council Chambers 6:00 pm – 9:00 pm
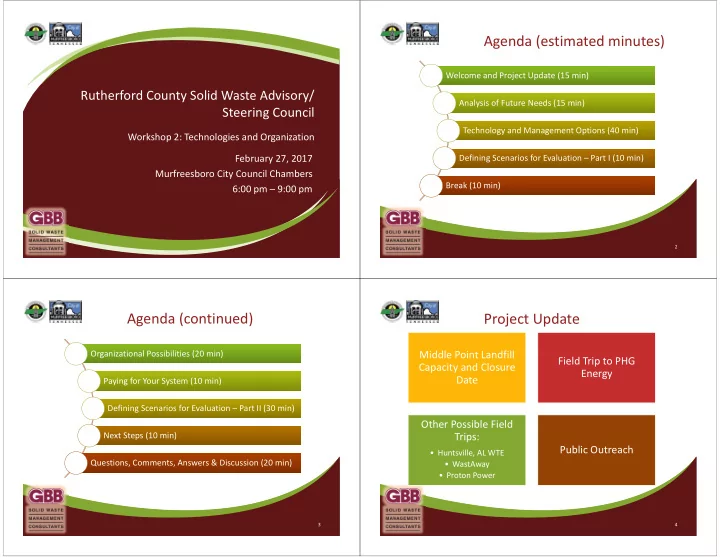
Agenda (estimated minutes)
2
Welcome and Project Update (15 min) Welcome and Project Update (15 min) Analysis of Future Needs (15 min) Analysis of Future Needs (15 min) Technology and Management Options (40 min) Technology and Management Options (40 min) Defining Scenarios for Evaluation – Part I (10 min) Defining Scenarios for Evaluation – Part I (10 min) Break (10 min) Break (10 min) Organizational Possibilities (20 min) Organizational Possibilities (20 min) Paying for Your System (10 min) Paying for Your System (10 min) Defining Scenarios for Evaluation – Part II (30 min) Defining Scenarios for Evaluation – Part II (30 min) Next Steps (10 min) Next Steps (10 min) Questions, Comments, Answers & Discussion (20 min) Questions, Comments, Answers & Discussion (20 min)
Agenda (continued)
3
Middle Point Landfill Capacity and Closure Date Field Trip to PHG Energy Other Possible Field Trips:
- Huntsville, AL WTE
- WastAway
- Proton Power
Public Outreach
Project Update
4