Adult Spinal Deformity Surgical Complications and Surgical - - PDF document

adult spinal deformity
SMART_READER_LITE
LIVE PREVIEW

Adult Spinal Deformity Surgical Complications and Surgical - - PDF document

Introduction Adult Spinal Deformity Surgical Complications and Surgical intervention can have a significant impact Classification Complications can be significant 9 th Annual UCSF Practical Course in Advanced Spinal Techniques Eric


slide-1
SLIDE 1

SPINE CENTER UCDA DAVIS

Adult Spinal Deformity Surgical Complications and

Classification

Eric Klineberg, MD Professor and Vice Chair Department of Orthopaedics University of California, Davis

9th Annual UCSF Practical Course in Advanced Spinal Techniques

SPINE CENTER UCDA DAVIS I have no financial interest with any company regarding this subject

Eric Klineberg, MD

Consulting: Depuy/Synthes, Stryker, Medicrea Speaking: AO Spine Fellowship Funding: AO Spine SPINE CENTER UCDA DAVIS
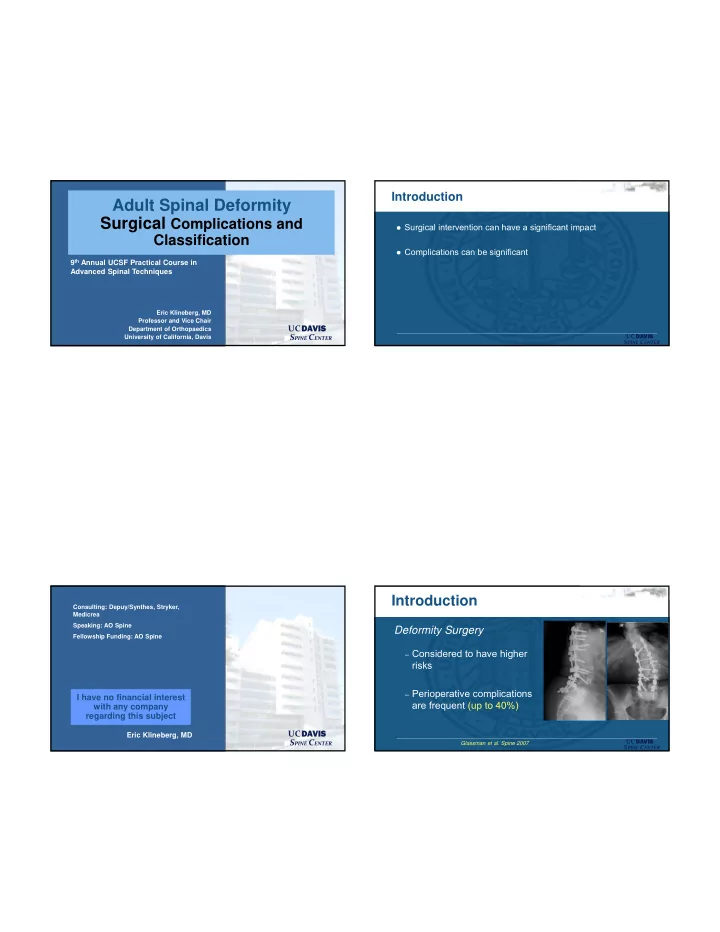
Introduction

 Surgical intervention can have a significant impact  Complications can be significant SPINE CENTER UCDA DAVIS

Introduction

Deformity Surgery

– Considered to have higher

risks

– Perioperative complications

are frequent (up to 40%)

Glassman et al. Spine 2007

slide-2
SLIDE 2

SPINE CENTER UCDA DAVIS

What is a complication?

 com·pli·ca·tion  noun \ˌkäm-plə-ˈkā-shən\ : something that makes something

harder to understand, explain, or deal with

 medical : a disease or condition that happens in addition to

another disease or condition : a problem that makes a disease

  • r condition more dangerous or harder to treat

SPINE CENTER UCDA DAVIS

What is a complication?

Does it matter?

Complication List Infection  Major

  • Deep, Pneumonia, Sepsis

 Minor

  • Superficial, UTI, C Diff infection

Implant  Major

  • Hook dislodgement, Interbody fracture/migration, Rod fracture/dislodgement, Screw fracture

 Minor

  • Painful/promininent, Screw malposition/loosening, Interbody subsidence/dislodgement

Radiographic  Major

  • DJK, PJK, Pseudoarthrosis

 Minor

  • Coronal/Sagittal imbalance, Curve decompensation, HO, Adjacent segment degeneration

Neurologic  Major

  • Visual deficit/blindness, Brachial plexus injury, CVA/Stroke, Spinal cord injury, Nerve root injury

with weakness, Retrograde ejaculation, Bowel/Bladder deficit  Minor

  • Neuropathy or sensory deficit, Pain (radiculopathy), Peripheral nerve palsy, Delirium

Mortality  All major Cardiopulmonary  Major

  • Cardiac arrest, PE, Respiratory arrest, DVT, MI, Reintubation, ARDS

 Minor 

  • Coagulopathy, Arrhythmia, Pleural effusion, Hypotension, CHF

Gastrointestinal  Major

  • Obstruction, Perforation, Bleed requiring surgery, Pancreatitis/Cholecystitis requiring surgery, Liver

Failure, SMA Syndrome  Minor

  • Ileus, Bleed not requiring surgical intervention, Pancreatitis/Cholecystitis no surgery

Renal  Major

  • Acute Renal failure requiring dialysis

 Minor

  • Acute Renal failure requiring medical intervention

Operative  Major

  • Retained sponge/instrument, Wrong surgical level, Unintended extension of fusion, Vascular injury,

Visceral injury, EBL >4L  Minor

  • Dural tear, Fixation failure (hook/screw), Pedicle fracture, Posterior element fracture, Vertebral body

fracture Wound Problems  Major

  • Dehiscence requiring surgery, Hematoma/seroma requiring surgery +/- neurological deficit,

Incisional hernia  Minor

  • Hematoma/seroma not requiring surgery, Hernia

SPINE CENTER UCDA DAVIS

INTRODUCTION

 Glassman et al

– major and minor complications did not adversely

effect the improvement found in the HRQOL measures

– except for deterioration in the SF-12 for major

complications.

 Theorized that outcome instruments were

not sensitive enough to detect a difference

 Perioperative complications may not have a

continued impact at one year.

SPINE CENTER UCDA DAVIS

What is a complication?

 Physician and patient dependent

slide-3
SLIDE 3

SPINE CENTER UCDA DAVIS

Prevention

 Medical Optimization

– Cardiac – Pulmonary – Nutritional – Metabolic – Bone Quality – What about consent?

SPINE CENTER UCDA DAVIS  Informed Consent  Despite ranking the consent process as

important, patient recall was only 41% immediately after discussion and video re- enforcement.

 Recall subsequently declined to 20% at 6

months post-operatively.

SPINE CENTER UCDA DAVIS

Prevention

 Medical Optimization

– Cardiac – Pulmonary – Nutritional – Metabolic – Bone Quality

SPINE CENTER UCDA DAVIS

Surgical Strategy

slide-4
SLIDE 4

SPINE CENTER UCDA DAVIS

Surgical Strategy

SPINE CENTER UCDA DAVIS

Surgical Strategy

SPINE CENTER UCDA DAVIS

Complication Category Peri-op (<6wks) minor/major (%) Delayed (>6wks) minor/major (%) Total minor/major (%) Implant 3/8 (3.8) 11/59 (24.1) 14/67 (27.8) Radiographic 4/10 (4.8) 25/42 (23.0) 29/52 (27.8) Neurologic 21/24 (15.5) 16/20 (12.4) 37/44 (27.8) Operative 41/32 (25.1) 0/1 (0.3) 41/33 (25.4) Cardiopulmonary 31/20 (17.5) 1/3 (1.4) 32/23 (18.9) Infection 11/20 (10.7) 5/7 (4.1) 16/27 (14.8) Gastrointestinal 24/1 (8.6) 0/0 (0) 24/1 (8.6) Wound (excluding infection) 3/7 (3.4) 0/5 (1.7) 3/12 (5.2) Vascular 4/0 (1.4) 1/0 (0.3) 5/0 (1.7) Musculoskeletal 0/0 (0) 3/0 (1.0) 3/0 (1.0) Renal 1/2 (1.0) 0/0 (0) 1/2 (1.0) Other 2/1 (1.0) 0/0 (0) 2/1 (1.0) Total (minor/major) 270 (145/125) 199 (62/137) 469 (207/262) Mean # complications/patient (minor/major) 0.93 (0.50/0.43) 0.68 (0.21/0.47) 1.61 (0.71/0/90) Number of patients affected (%) 150 (51.5) 124 (42.6) 203 (69.8)

Results: 246 patients with 2 year f/u

SPINE CENTER UCDA DAVIS

Complication Category Peri-op (<6wks) minor/major (%) Delayed (>6wks) minor/major (%) Total minor/major (%) Implant 3/8 (3.8) 11/59 (24.1) 14/67 (27.8) Radiographic 4/10 (4.8) 25/42 (23.0) 29/52 (27.8) Neurologic 21/24 (15.5) 16/20 (12.4) 37/44 (27.8) Operative 41/32 (25.1) 0/1 (0.3) 41/33 (25.4) Cardiopulmonary 31/20 (17.5) 1/3 (1.4) 32/23 (18.9) Infection 11/20 (10.7) 5/7 (4.1) 16/27 (14.8) Gastrointestinal 24/1 (8.6) 0/0 (0) 24/1 (8.6) Wound (excluding infection) 3/7 (3.4) 0/5 (1.7) 3/12 (5.2) Vascular 4/0 (1.4) 1/0 (0.3) 5/0 (1.7) Musculoskeletal 0/0 (0) 3/0 (1.0) 3/0 (1.0) Renal 1/2 (1.0) 0/0 (0) 1/2 (1.0) Other 2/1 (1.0) 0/0 (0) 2/1 (1.0) Total (minor/major) 270 (145/125) 199 (62/137) 469 (207/262) Mean # complications/patient (minor/major) 0.93 (0.50/0.43) 0.68 (0.21/0.47) 1.61 (0.71/0/90) Number of patients affected (%) 150 (51.5) 124 (42.6) 203 (69.8)

slide-5
SLIDE 5

SPINE CENTER UCDA DAVIS

Can We Develop A Better Complication Score?

 We rely on AE/Minor/Major determination

– No consensus – Severity of complication may be biased

 Can a less biased score better predict HRQoL outcomes? SPINE CENTER UCDA DAVIS

CMS

 Increased interest in complications and when they occur  All complications that occur within 30 days from the operation  All readmission/reoperations that occur within 90 days  May have significant impact with bundling of payments SPINE CENTER UCDA DAVIS

Canadian (SAVES)

 Have led the way with the development of a intervention

severity score

– Use a scale from I-IV to determine severity (or grades 1-6) – Also assign a Length Of Stay modifier – Do not have specific score for neurology, readmission or reoperation – How we obtain the information is critical

SPINE CENTER UCDA DAVIS

AO Spine/Scoli-Risk-1

 Gathers info for non-neurologic complications  Granular information regarding neurologic injury  Defines the neurologic injury

– (cord, motor, sensory, incontinence etc…) – Level of injury

 Describes timing, intervention, and outcome

slide-6
SLIDE 6

SPINE CENTER UCDA DAVIS  Factor that predicted 2-year SF-36PCS

– Age (p < .001), ASA grade (p < .001) – Maximum preoperative Cobb angle (p = .007) – Number of three-column osteotomies (p = .049) – Type of neurologic complication (p = .068)

 Factors predictive of 2-year SRS-22R Total scores  Maximum preoperative Cobb angle (p = .001)  Number of serious adverse events (p = .071) SPINE CENTER UCDA DAVIS

Do Complications Effect HRQoL?

 355 pts prospectively enrolled in the ISSG

multicenter study

 202 met the inclusion criteria  Mean age 57.4, levels fused 12  Four groups identified:

– No Complications

N=84

– Minor Complications

N=87

– Major Complications

N=65

– Both Major and Minor

N=35

SPINE CENTER UCDA DAVIS

Baseline Pre-OP Demographics

 Similar distribution for Age, BMI, and ASA, as

well as Pre-OP spinopelvic parameters.

 Sig lower Charlson Comorbidity Index for the

no complication group.

No Complications Minor Major Both p‐value Age 55.2 57.7 61.1 58.8 0.072 BMI 26.9 27.3 28.1 28.4 0.487 ASA 2.2 2.4 2.4 2.4 0.06 Charlson 1.2 1.9 2.0 1.9 0.015* Smoker (%) 6 11 8 11 0.693 SVA (mm) 45.6 53.9 68.6 68.5 0.217 Max Cobb (Degrees) 41.5 45.0 41.9 44.2 0.689 Prior Spine Fusion Surgery (%) 75.0 73.0 80.6 70.6 0.853

SPINE CENTER UCDA DAVIS

Operative Summary

 Trend towards > PSO for Major and Both complication groups  No complication group also had the lowest percent of BMP,

anterior approach, EBL and Time in the OR.

May be a surrogate for surgical complexity. No Complications Minor Major Both p‐value Levels Fused 12.0 11.9 12.3 12.4 0.825 Osteotomy (%) 71.1 55.6 71.4 73.0 0.997 PSO/PVCR (%) 22.9 21.1 31.7 29.7 0.413 BMP (%) 51.8% 86.7% 86.5% 69.8% 0.0001 Anterior (%) 14.5 30.0 30.2 40.5 0.013 EBL (cc) 1783 2061 2698 2704 0.005* OR Time (min) 412 494 517 533 0.0001** Length of Stay (Days) 8.0 8.9 10.5 9.9 0.073

slide-7
SLIDE 7

SPINE CENTER UCDA DAVIS

Baseline/1 Year HRQoL

All Complication No Complication Major Minor Both P values Baseline ODI (Std) 42.5 (19.6) 41.3 (19.5) 46.4 (17) 39.5 (19.5) 42.5 (16.9) NS 1 year ODI (Std) 28.3 (20.2) 26.6 (18.6) 29.9 (20) 26.9 (20.0) 28.1 (19.5) NS Baseline PCS (Std) 32.9 (10.3) 32.9 (9.75) 31.1 (8.8) 33.9 (10.3) 31.8 (9.9) NS 1 year PCS (Std) 39.5 (11.1) 41.3 (10.9) 38.0 (12) 40.7 (10.8) 39.8 (11.3) NS Significant improvement in All groups from Baseline to 1 year

No differences between groups for any of the outcome measures, regardless of complication SPINE CENTER UCDA DAVIS

1 Year HRQoL

Significant impact on ODI and PCS for readmission, reoperation and no complication resolution.

No Readmission Readmission P Value 1 year ODI 24.5 39.5 P < 0.01 1 year PCS 41.3 31.9 P < 0.01 No Reoperation Reoperation 1 year ODI 24.8 37.1 P < 0.01 1 year PCS 41.1 33.9 P < 0.01 Resolution Of Complication No Resolution 1 year ODI 24.5 39.5 P < 0.01 1 year PCS 41.3 31.9 P < 0.01

SPINE CENTER UCDA DAVIS

ISSG/AO/ESSG

 Working to develop a comprehensive score  Using:

– 1. Complication Category – 2. Intervention severity – 3. Complication Severity – 4. Neurologic severity – 5. Reoperation/readmission – 6. Resolution of complication – 7. Timing/Effect on LOS

SPINE CENTER UCDA DAVIS

Complication Grading System

Complication Score 1 2 3 Severity Adverse Event Minor Major Death Intervention None Non-Invasive Invasive Surgical Neurologic Sensory Motor Bowel/Bladder Spinal Cord Injury Impact on Length

  • f Stay

None <2 days 3-7 days >7 days Readmission No Yes Revision Surgery No Yes Resolution Resolved Unresolved Timing Intra-op In Hospital Early Post-Op (<90 days) Late Post OP (>3 mo - 1 yr)

slide-8
SLIDE 8

SPINE CENTER UCDA DAVIS

Application of the system

 Different components of the score could be used for different

  • utcome metrics

 Ie: LOS vs HRQoL SPINE CENTER UCDA DAVIS

Complication Impact on LOS

 Univariate analysis identified factors that correlated with

increase over predicted LOS:

– cumulative complication severity (OR 1.23, p=.0001) – cumulative intervention severity (OR 1.15, p=0.0001) – number of complications (OR 1.26, p=.02)

 Development of a model to predict hospital LOS based on

complications

– Actual LOS was sigificantly higher than predicted LOS (10.7 days vs

8.3 days, p=0.0001)

SPINE CENTER UCDA DAVIS

Impact on HRQoL at 2 years

 Minimum one complication had lower 2-yr

improvements in HRQL

– (SF-36 PCS 6.91 vs 9.48, p=.012, and SRS-22r 0.79 vs 0.95,

p=.03).  Number of complications

– (PCS -0.1159, p=.016, SRS -0.0929, p=.048)

SPINE CENTER UCDA DAVIS

Impact on HRQoL at 2 years

 Severity Score:

– maximum severity score (PCS -0.1157, p=0.016) – cumulative severity score (PCS -0.1223, p=.011, SRS -0.1487, p=.03)

 Intervention Score:

– Maximum intervention score (PCS -0.16, p=.001, SRS -0.125, p=.008) – Cumulative Intervention Score (PCS 0.1245, p=.0096)

 Complication resolution:

– resolved complication PCS -2.22, p=.048, – unresolved complication PCS -3.12 p=.012

slide-9
SLIDE 9

SPINE CENTER UCDA DAVIS

Spine Complication Classification

 A simple classification system with discrete data points  A more comprehensive one with additional data points and

subgroups that captures more granular data.

 Determining what data points need to be acquired is our first

challenge

SPINE CENTER UCDA DAVIS

Complication Category

 Each complication receives a categorical letter and sub-letter to

define its primary complication category

 Then each complication is stratified into the four complication

modifiers:

– neurologic – timing – intervention severity – resolution

SPINE CENTER UCDA DAVIS

Universal Spine Complication Classification

Neurological Timing Intervention Resolution

Classification

SPINE CENTER UCDA DAVIS Neurological LEMS Score Severity No Deficit Sensory only +/- Pain Motor +/- Impact on ambulatory status Spinal Cord Injury +/- Impact on ambulatory status +/- Impact on bowel/bladder function

Neurologic Sub Score

slide-10
SLIDE 10

SPINE CENTER UCDA DAVIS

Timing (of complication diagnosis) Intraoperative In-Hospital +/- Reoperation +/- <30 days Post-discharge <30 days +/- Readmission +/- Reoperation 30-90 days +/- Readmission +/- Reoperation >90 days +/- Readmission +/- Reoperation

Timing Sub Score

SPINE CENTER UCDA DAVIS

Intervention (choose highest) Mild consultation, lab values, diagnostic imaging, small needle intervention (contrast, epidural, transfusion) Moderate large needle intervention (PICC line, chest tube, angiocath, dialysis), cardioversion Severe Surgical treatment (knife intervention)

Intervention Sub Score

SPINE CENTER UCDA DAVIS

Resolution status Complete resolution Partial resolution Unresolved (unchanged) Death

Resolution Sub Score

SPINE CENTER UCDA DAVIS

Universal Spine Complications Classification

Medical Neurological Timing Intervention Resolution Surgical Neurological Timing Intervention Resolution

ISSG/AO/ESSG

slide-11
SLIDE 11

SPINE CENTER UCDA DAVIS

Validation

 Identification and classification of complications can be difficult,

and simple categories will improve our ability to classify and quantify the impact of complications.

 Intrinsic surgeon bias may increase accuracy of reporting for

some complications more then others

– Ie better reporting of surgical vs medical complications

SPINE CENTER UCDA DAVIS

Methods

 10 randomized cases were sent to

participants, and they were asked to identify the complications and complete a standardized data collection form.

 There were 34 events that occurred:

– 25 events with only one complication – 5 with 2 complications – 4 with 2 or more complications

Cat N % Cases with Mean StD Gastro 2 20% 0.2 0.421637 Musculoskeletal 3 30% 0.3 0.483046 CNS 3 30% 0.3 0.483046 Cardiac 5 20% 0.5 1.080123 Pulmonary 1 10% 0.1 0.316228 Renal 1 10% 0.1 0.316228 Radiographic 4 30% 0.4 0.699206 Neurologic 7 50% 0.7 0.948683 Operative 8 70% 0.8 0.632456 Wound/Approach 2 10% 0.2 0.632456 Implant 1 10% 0.1 0.316228

SPINE CENTER UCDA DAVIS

Results

 17 people filled out all questionnaires:

– 10 attending surgeons, 5 trainees, and 2 research

coordinators.

 Overall accuracy

– 87.4% high level (i.e. neurologic vs gastrointestinal vs cardiac

etc.)

– 75.7% with more granular data (i.e. motor deficit vs ileus vs MI

etc).

 Accuracy for medical and surgical complications is

similar

– (87.6% vs 87.1% for high level, 77.4% vs 74.3% for detail).

SPINE CENTER UCDA DAVIS

Results

 Highest overall accurate rate

– CVA, gastrointestinal and

radiographic (above 94%)

 Lowest overall accurate rate

– renal (44.8%), pulmonary

(54.5%) cardiac (55%).

 Overall event accuracy

(combination of complications

  • ccurring simultaneously) is

57.1%.

HighLevel 2 Detail Level 3 Gastro 94.1% 94.1% Musculoskeletal 80.6% 80.6% CNS 100.0% 98.1% Cardiac 88.2% 55.0% Pulmonary 54.5% 54.5% Renal 81.3% 44.8% Radiographic 96.2% 96.2% Neurologic 77.9% 66.9% Operative 89.7% 79.6% Wound/Approach 100.0% 65.6% Implant 81.3% 81.3%

slide-12
SLIDE 12

SPINE CENTER UCDA DAVIS

Results

 Neurologic impairment per event was accurate for

79.1%.

 Intervention severity is 79.6% accurate, with the highest

rate for severe intervention (98.6%).

 Resolution was accurately reported for 70.3% of the

events

– 80.1% for Resolved – 42.9% for Unresolved SPINE CENTER UCDA DAVIS

Conclusions

 Accurate reporting and gathering of

complications is difficult to standardize.

 In this cased based survey, complex

complications were categorized accurately 87%, neuro deficits accurately 79%, intervention accuracy of 80% and resolution accuracy of 70%.

 Surgeons need to be actively involved in

complication reporting to enhance accuracy.

SPINE CENTER UCDA DAVIS

Does this system help us?

 What is the effect / incidence of timing?  What is the effect on HRQL?  Can it predict LOS? SPINE CENTER UCDA DAVIS

Background: Timing of complication

 The timing and impact of complications over time is important to

understand for patients, payors and providers. While most medical and operative complications occur proximate to the index surgical intervention, complications may occur at any time point during the care of our adult spinal deformity patients.

 Understanding the timing of specific complications may be

helpful to guide patients and surgeons. The impact of those complications on health outcomes at 2 years is also critically important.

slide-13
SLIDE 13

SPINE CENTER UCDA DAVIS

Comps

Intra Operative Before discharge After discharge Sum % Event Sum % Event Sum % Event Adverse Event 43 28.9% 73 47.1% 71 23.3% Cardiopulmonary 14 9.4% 41 26.5% 20 6.6% Gastrointestinal 3 2.0% 37 23.9% 4 1.3% Implant 6 4.0% 1 0.6% 111 36.4% Infection 1 0.7% 21 13.5% 31 10.2% Neurologic 19 12.8% 19 12.3% 61 20.0% Operative 97 65.1% 7 4.5% 6 2.0% Other 0.0% 1 0.6% 2 0.7% Radiographic 0.0% 1 0.6% 130 42.6% Renal 0.0% 3 1.9% 0.0% Wound 1 0.7% 2 1.3% 7 2.3% Before 30D Between 30 and 90D After 90D Sum % Event Sum % Event Sum % Event Adverse Event 82 55.0% 12 7.7% 55 18.0% Cardiopulmonary 51 34.2% 7 4.5% 3 1.0% Gastrointestinal 39 26.2% 1 0.6% 1 0.3% Implant 6 4.0% 6 3.9% 100 32.8% Infection 39 26.2% 11 7.1% 3 1.0% Neurologic 27 18.1% 18 11.6% 36 11.8% Operative 10 6.7% 1 0.6% 2 0.7% Other 2 1.3% 0.0% 1 0.3% Radiographic 11 7.4% 21 13.5% 99 32.5%

584/732 patients met inclusion criteria (mean age 58.6yrs, 78% female, mean BMI 27.5, mean CCI 1.64, mean ODI 43.5). 70.9% had least one complication event

  • ver the 2-year

period, with an average of 1.45 events per patient.

SPINE CENTER UCDA DAVIS

Complications over time….

Early Continue

SPINE CENTER UCDA DAVIS

All Complications: Relationship to Timing

All Complications

SPINE CENTER UCDA DAVIS

Propensity Matching

grp Mean p BEFORE MATCHING BL_ODI 40.34 0.001 1 45.85 BL_PCS 33.92 0.000 1 30.62 demo_AgeBase 0 55.86 0.001 1 60.31 BL_Frailty_Index 0 2.909 0.000 1 3.504 LATpre_PI_LL 12.54 0.003 1 18.08 AFTER MATCHING BL_ODI 42.15 0.791 1 41.66 BL_PCS 32.84 0.878 1 33.00 demo_AgeBase 0 57.69 0.938 1 57.81 BL_Frailty_Index 0 3.054 0.790 1 3.013 LATpre_PI_LL 14.44 0.587 1 15.62 grp Mean p Y2_ODI 23.43 0.104 1 26.72 Y2_PCS 42.60 0.043 1 40.24 Y2_MCS 51.17 0.925 1 51.29 Y2_SRS_ACTIVITY 3.75 0.168 1 3.61 Y2_SRS_PAIN 3.65 0.055 1 3.44 Y2_SRS_APPEARANCE 3.78 0.143 1 3.64 Y2_SRS_MENTAL 3.90 0.933 1 3.91 Y2_SRS_SATIS 4.30 0.093 1 4.13 Y2_SRS_TOTAL 3.82 0.133 1 3.70 Y2_SF36_PF 41.09 0.015 1 38.20 Y2_SF36_RP 42.53 0.522 1 41.72 Y2_SF36_BP 45.83 0.053 1 43.56 Y2_SF36_GH 49.30 0.347 1 48.19 Y2_SF36_VT 49.73 0.372 1 48.66 Y2_SF36_SF 45.88 0.680 1 45.37 Y2 SF36 RE 46 62

  • With only one

complication: regardless

  • f type had worse final
  • utcomes then no comps
  • No complication:
  • ODI (40 to 22, p=0.01)
  • PCS (33.9 to 43, p=0.05)
  • One complication
  • ODI (45.8 to 30.5, p=0.05)
  • PCS (30.6 to 38, p=0.05)

When we sub-analyze for type of complication, those that occur early have minimal effect, while those that occur later have a much more significant effect.

slide-14
SLIDE 14

SPINE CENTER UCDA DAVIS

Conclusion: Timing

 Complications occur over-time and can be predicted by type.  Implant, radiographic and neurologic complications continue to

  • ccur over time, and need to be followed closely.

 Complication type is critical, and those complications that occur

later, and increase over-time are more impactful for our patients at 2 years.

 Determining the relationship of the timing of complications and

its impact to our patients is critical to understand.

SPINE CENTER UCDA DAVIS

LOS: Hypothesis

 Investigate the role of complications that occur during the initial

hospitalization to predict LOS based on a novel classification that includes treatment severity.

SPINE CENTER UCDA DAVIS

LOS: distribution

 This parameter is not

normally distributed

– Kolmogorov-Smirnov p =

1.1737E-27

 Comparison with poison

distribution

– Kolmogorov-Smirnov p =

0.103964 SPINE CENTER UCDA DAVIS

LOS Parameters

 List of surgical parameters simplified for

abstract analysis

– Posterior length of fusion:

 “short” versus “medium” versus “long” fusion – Threshold for short < 5 – Threshold for long > 13

– Major osteo versus no – IBF versus no IBF – Primary versus revision – Stage yes/no – Posterior only vs combined

N Mean StD Min Max 25th 50th 75th Length of fusion Short 102 4.24 2.09 1 11 3 4 5 Medium 407 6.43 2.01 2 12 5 6 7 Long 138 6.88 1.93 2 12 6 7 8 3 column ostotomy No Major 574 6.07 2.24 1 12 5 6 7 Major 86 6.57 1.84 3 12 5 6 8 Interbody fusion No 242 5.95 1.71 1 12 5 6 7 Yes 414 6.22 2.41 1 12 4.75 6 8 revision Primary 476 6.17 2.24 1 12 5 6 7 Revision 184 6.05 2.10 1 12 5 6 7 Approach Posterior Only 426 5.95 1.79 1 12 5 6 7 Anterior- Posterior (APSF) 223 6.58 2.72 1 12 4 7 9 Stage Same Day 492 5.79 1.97 1 12 5 6 7 Staged 109 8.11 2.13 2 12 7 8 9.5

slide-15
SLIDE 15

SPINE CENTER UCDA DAVIS

LOS Demographics

494 patients included in the analysis

Mean age: 61 year

73.8% female

28.07 kb/m2

Mean ASA grade was 2.44

45.3% Grade 2

45.7% Grade 3

Mean number of levels fused posterior:

11.6 +/- 3.9

Mean number of levels fused using IBF

2.5 +/- 1.6

77.3% underwent some type of osteotomy

26.1% underwent a major osteotomy (PSO / VCR)

78.7% same day surgery

SPINE CENTER UCDA DAVIS

LOS by Intervention

 During the hospital stay

– 65.1% of the maximum intervention where minor – 10.1% had at least one moderate intervention – 10.5% had at least one severe intervention

 Reop rate: 9.5%  Number of events per patient between surgery and discharge

– Mean Number events: 1.7 +/- 1.1

SPINE CENTER UCDA DAVIS

Multivariate Analysis

 4 independent predictors identified

– Group posterior fusion (short being reference)  Medium (p = 5.0798E-10)  Long (p = 8.7728E-12) – Major Osteo (No Major being reference)  Use of Major (p = 0.000986) – Stage (Same day being reference)  Stage (p = 0.0E0) – Intervention (No complication being reference)  No intervention (p = 0.000219)  Minor intervention (p = 0.000004)  Moderate intervention (p = 0.000006)  Severe intervention (p = 0.006724)

SPINE CENTER UCDA DAVIS

Predicators of LOS

 3 parameters are significant

independent predictor of LOS

– Posterior fusion length group – Stage yes/no – Intervention

slide-16
SLIDE 16

SPINE CENTER UCDA DAVIS

Conclusion: LOS

 LOS is correlated to in-hospital complications and to

complication intervention severity.

 Surgical factors that affect LOS included length of fusion, major

  • steotomy or need for staged surgery.

 Increased invasiveness of complication treatment was identified

by a novel complication severity assessment scale as the only non-surgical factor that independently predicted increased hospital LOS following ASD surgery.

SPINE CENTER UCDA DAVIS

Much left to understand

 Relationship of complication to HRQoL measure (ie timing)

– Likely a correlation, and effect of complication weaken with time – Complication that has no effect now, but does later

 Cost of complication

– May use scoring system

 Consensus for component score

– AO Spine, ISSG, ESSG, Canadians, others….

 Development of a complication score SPINE CENTER UCDA DAVIS

  • Although surgical treatment for ASD can improve pain and

disability, it is associated with high rates of complications.

  • Many complications likely have minimal or no impact on

ultimate patient outcome at 2 years

  • But may have impact on LOS, cost, recovery time
  • No classification is currently able to predict LOS or HRQoL
  • Can a comprehensive scores better classify complications for

us and our patients?

Conclusion