Achieving kWh savings through pumping systems efficiencies Ignacio - - PowerPoint PPT Presentation

achieving kwh savings through pumping systems efficiencies
SMART_READER_LITE
LIVE PREVIEW

Achieving kWh savings through pumping systems efficiencies Ignacio - - PowerPoint PPT Presentation

Achieving kWh savings through pumping systems efficiencies Ignacio (Iggy) Pont Lezica Project Manager, Pumping Systems Energy Efficiency Thames Water Brian Conway Director Pump Management Boulting Group Synopsis Soaring energy


slide-1
SLIDE 1

Achieving kWh savings through pumping systems efficiencies

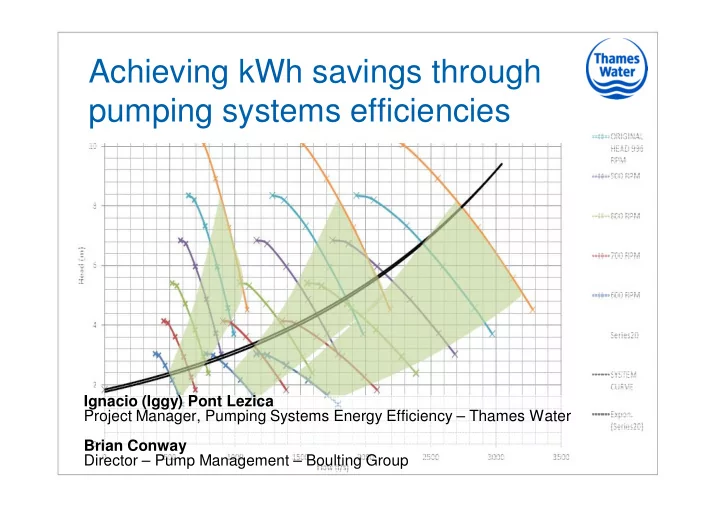
Ignacio (Iggy) Pont Lezica Project Manager, Pumping Systems Energy Efficiency – Thames Water Brian Conway Director – Pump Management – Boulting Group

slide-2
SLIDE 2

2

Synopsis

Soaring energy costs and regulatory drivers have

placed energy efficiency high on the agenda in the water industry. Within annual energy budget of close to £ 100 million, and pumping accounting for approximately 65% of this, there is an obvious case for achieving efficiencies through better pumping. In this presentation we will show the methodology employed, talk about some of the types of

  • pportunities found, and give some examples of

what has been achieved.

slide-3
SLIDE 3

Introduction

Drivers behind pumping efficiencies programme How this is being delivered Examples

slide-4
SLIDE 4

4

Background

TW spends close to £100m on energy Pumping accounts for 65% of this figure Regulatory drive to reduce energy consumption Benefit for the company (bottom line and brand) TW target goes beyond Ofwat regulatory target (in

line with UK targets) – 20% reduction in energy use by 2015 based on 1990 levels

slide-5
SLIDE 5

5

Process

Business case put forward to the investment

committee

Lump sum was allocated to the project based on

estimated savings – no specific sites or solutions were identified

Framework contract was put out to tender

slide-6
SLIDE 6

6

Working in partnership

Framework based on accuracy of savings identified vs savings

delivered – gives confidence in the project

Initial teething issues, in particular understanding how different

geographical areas of the company operate in different ways

Some initial resistance based on pumping misconceptions Open contractual approach to targets and delivery options

slide-7
SLIDE 7

7

Overview Desktop Study Test Analyse Report Recommend Implement Monitor Validate

Methodology

Shortlist sites based on yearly kW consumption and local knowledge Selection of solutions based on kWh savings and ROI, to date ROI has been as short as 0m, and savings as large as 1.4gWh/year

slide-8
SLIDE 8

Measurement SEC – Specific Energy Consumption

What is it

– Provides a means of performance standardisation for all Pump Stations

Units

– kWh/Ml (energy used per Megalitre transferred) – kWh/Ml/m (energy used per Megalitre transferred per metre of system head)

8

slide-9
SLIDE 9

9

Sample Recommendations

  • Ashford LLPS - East (reinstate siphonic recovery, PLC control)
  • King George V (manual modification and operator training based on SEC)
  • Kempton HLPS (Impeller trim, pump refurbishment and operator training)
  • Hampton low lift (new motor + VSD + PSOp™)
  • Cricklewood / Shortlands (new motor + VSD + change of control philosophy)
  • Littleton RWPS (pump refurbishment or replace pumps)
  • North Leigh BPS (PSOp™ implementation in to PLC/SCADA)
  • Swinford Dam RWPS (PSOp™ implementation in to PLC/SCADA)
slide-10
SLIDE 10

10

Worked examples

Swinford Dam RWPS Ashford Low Lift East PS Swinford North Leigh BPS

slide-11
SLIDE 11

11

Swinford – North Leigh BPS

Transfer from Beacon Hill SR to North Leigh SR

– Average 25Mld transfer rate – Approx 35% system friction – 3 pumps (duty/assist/standby) – Equipment in good condition – All installed with VSD – Demand input from Control Centre based on North Leigh reservoir level

slide-12
SLIDE 12

12

Swinford – North Leigh BPS

Details provided in Conference Presentation

– Please contact presenter for full details

slide-13
SLIDE 13

13

Swinford – Dam RWPS

Transfer from Farmoor Reservoir to Swinford WTW

– Average 65Mld transfer rate – Up to 60Mld by gravity (dependant on reservoir level) – 2 pumps (duty/standby) – Equipment in good condition – All installed with VSD – Demand input from WTW with manual control – Needs to maintain level in main intake sump to WTW

slide-14
SLIDE 14

14

Swinford Dam RWPS

Details provided in Conference Presentation

– Please contact presenter for full details

slide-15
SLIDE 15

Ashford Common WTW - LLPS

  • Transfer of filtered water to

contact tanks – Average daily capacity approx 550Mld – Capacity controlled by maintaining sump level – 2 sumps, each with 4 pumps – 2 discharge mains to contact tanks – All pumps fitted with VSDs (ageing) – Pumps installed with discharge siphon 15

slide-16
SLIDE 16

16

Ashford Common WTW - LLPS

Details provided in Conference Presentation

– Please contact presenter for full details

slide-17
SLIDE 17

Summary

Lots of savings to be found in pumping systems Big challenges ahead Working together achieves the best results

slide-18
SLIDE 18

Contact Details

Brian Conway Boulting Group Ltd Chapel Road Penketh Warrington WA5 2PL Tel. 01925 446000 Mob. 07736 628996 E-mail brianconway@boulting.co.uk Web www.boulting.co.uk

18

Iggy Pont Lezica Thames Water Utilities Ltd Clearwater Court Vastern Road Reading, RG1 8DB Mob. 077 476 42318 E-mail ipl@thameswater.co.uk