ACCURATE QUANTITATIVE EVALUATION OF OXIDATION RATE OF SIC UNDER - - PDF document

accurate quantitative evaluation of oxidation rate of sic
SMART_READER_LITE
LIVE PREVIEW

ACCURATE QUANTITATIVE EVALUATION OF OXIDATION RATE OF SIC UNDER - - PDF document

18 TH INTERNATIONAL CONFERENCE ON COMPOSITE MATERIALS ACCURATE QUANTITATIVE EVALUATION OF OXIDATION RATE OF SIC UNDER ELEVATED TEMPERATURES Y. Kubota 1* , T. Yoshinaka 2 , H. Hatta 3 , Y. Kogo 4 , T. Goto 5 , T, Rong 5 1 Department of Space


slide-1
SLIDE 1

18TH INTERNATIONAL CONFERENCE ON COMPOSITE MATERIALS

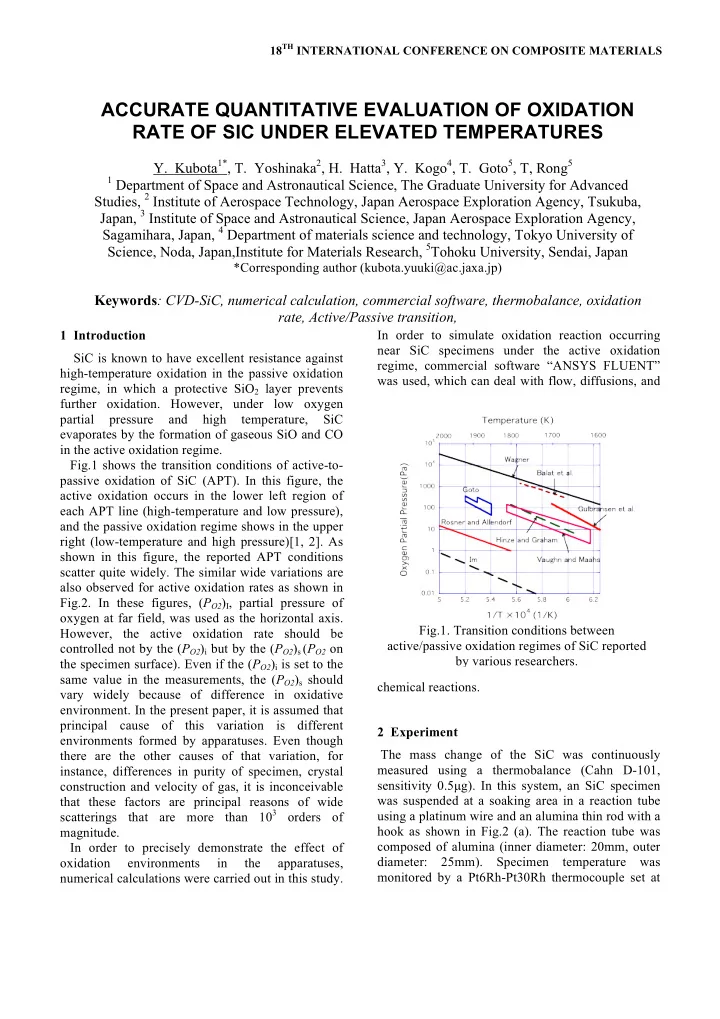
1 Introduction SiC is known to have excellent resistance against high-temperature oxidation in the passive oxidation regime, in which a protective SiO2 layer prevents further oxidation. However, under low oxygen partial pressure and high temperature, SiC evaporates by the formation of gaseous SiO and CO in the active oxidation regime. Fig.1 shows the transition conditions of active-to- passive oxidation of SiC (APT). In this figure, the active oxidation occurs in the lower left region of each APT line (high-temperature and low pressure), and the passive oxidation regime shows in the upper right (low-temperature and high pressure)[1, 2]. As shown in this figure, the reported APT conditions scatter quite widely. The similar wide variations are also observed for active oxidation rates as shown in Fig.2. In these figures, (PO2)I, partial pressure of

  • xygen at far field, was used as the horizontal axis.

However, the active oxidation rate should be controlled not by the (PO2)i but by the (PO2)s (PO2 on the specimen surface). Even if the (PO2)i is set to the same value in the measurements, the (PO2)s should vary widely because of difference in oxidative

  • environment. In the present paper, it is assumed that

principal cause of this variation is different environments formed by apparatuses. Even though there are the other causes of that variation, for instance, differences in purity of specimen, crystal construction and velocity of gas, it is inconceivable that these factors are principal reasons of wide scatterings that are more than 103 orders of magnitude. In order to precisely demonstrate the effect of

  • xidation

environments in the apparatuses, numerical calculations were carried out in this study. In order to simulate oxidation reaction occurring near SiC specimens under the active oxidation regime, commercial software “ANSYS FLUENT” was used, which can deal with flow, diffusions, and chemical reactions. 2 Experiment The mass change of the SiC was continuously measured using a thermobalance (Cahn D-101, sensitivity 0.5µg). In this system, an SiC specimen was suspended at a soaking area in a reaction tube using a platinum wire and an alumina thin rod with a hook as shown in Fig.2 (a). The reaction tube was composed of alumina (inner diameter: 20mm, outer diameter: 25mm). Specimen temperature was monitored by a Pt6Rh-Pt30Rh thermocouple set at

ACCURATE QUANTITATIVE EVALUATION OF OXIDATION RATE OF SIC UNDER ELEVATED TEMPERATURES

  • Y. Kubota1*, T. Yoshinaka2, H. Hatta3, Y. Kogo4, T. Goto5, T, Rong5

1 Department of Space and Astronautical Science, The Graduate University for Advanced

Studies, 2 Institute of Aerospace Technology, Japan Aerospace Exploration Agency, Tsukuba, Japan, 3 Institute of Space and Astronautical Science, Japan Aerospace Exploration Agency, Sagamihara, Japan, 4 Department of materials science and technology, Tokyo University of Science, Noda, Japan,Institute for Materials Research, 5Tohoku University, Sendai, Japan

*Corresponding author (kubota.yuuki@ac.jaxa.jp)

Keywords: CVD-SiC, numerical calculation, commercial software, thermobalance, oxidation rate, Active/Passive transition,

Fig.1. Transition conditions between active/passive oxidation regimes of SiC reported by various researchers.

slide-2
SLIDE 2

just downstream of the specimen. Reaction gas was introduced from the upper part of the tube and exhausted from the bottom. Oxidation behavior in a thermobalance fabricated by Ulvac Japan (TGD 9600, see Fig.2 (b)) was also simulated for discussion of the effect of oxidation environments. The oxidation tests were carried out according to the following procedure. The temperature increased step-by-step at a (PO2)i in O2-Ar atmosphere equal to 50Pa and total gas pressure to 0.1MPa. The temperature was changed in a range between 1840K and 1973K, and the total gas velocities were varied from 1.34×10⁻⁶m3/s to 2.43×10⁻⁶m3/s. At each step, constant temperature was maintained for 15 min, in which the first five minutes was assumed as the time to reach a stable environment. The experiments were performed using high- density SiC plates prepared by chemical vapor deposition using a mixture of SiCl4, C3H8, and H2 as source materials. The SiC plates were of the β type, have a density of 3.2×10⁻³kg・m-3, and include impurities at ppb order, have the (111) crystalline plane on the plate surfaces. The specimens (0.6mm in thickness) were ultrasonically cut into a disk shape with 10mm diameter. The surface roughness

  • f specimens was 0.02µmRa and 0.2µmRa.

3 Analysis The oxidation reaction rate should be expressed as a function of the oxygen partial pressure PO2 on the reaction surface of a specimen (PO2)s. However, (PO2)s is difficult to experimentally determine, Hence, (PO2)s was calculated using a commercial software, “ANSYS FLUENT” based on the finite volume method. This software can deal with chemical reaction of gas and solid in laminar flow. Simulated environment around the specimen shown in Fig.2 (a) represents that of the high sensitivity thermobalance, Cahn D-101, and in Fig.2 (b) of TGD. The boundary conditions used in calculations were; 1) the temperature of the reaction tubes was constant, 2) at first, the reaction tube was filled with pure Ar, 3) at room-temperature, O2 begins to flow into a reaction tube at the start of calculation, and specimens were a disk (thickness:0.7mm, diameter:10mm) for Cahn R-100, and a cube (3×4×4mm) for TGD. The reaction gas was introduced from the top of the reaction tube and exhausted from the bottom in Cahn R-100, and from the bottom to the top in TGD. The Arrhenius parameters used in this study are shown in table.1. Table.1. Arrhenius parameters used in calculations Temperature T(K) Frequency factor A Activation energy Ea (J/mol) 1860.0 275.30 43810 1900.0 277.10 39860 1940.0 279.00 35670 1980.0 280.80 31640 4 Results 4.1 Adequacy of analysis Calculated active oxidation rates in Cahn R-100 were compared to observed values in Fig.3. As shown in this figure, calculated oxidation rates are closed to the published experimental-data [1, 2]. Similar excellent consistency was also obtained in terms of gas flow rate as a parameter. Fig.2. Specimen supporting-mechanisms of (a) Cahn R-100 and (b) TGD.

slide-3
SLIDE 3

3 ACCURATE QUANTITATIVE EVALUATION OF OXIDATION RATE OF SIC UNDER ELEVATED TEMPERATURES

4.2 Thermal gradient in the apparatus The temperatures of gases and the specimen are principal parameters determining an active oxidation rate of SiC as indicated in Eq.(1) [3]. k = RTgas 2πM exp − Ea RTSiC ⎛ ⎝ ⎜ ⎞ ⎠ ⎟ , K = k O2

[ ]SiC

s

(1) Here, k is the reaction rate constant, K is the reaction rate, Tx is the temperature of x, Ea is the activation energy, and [O2]s

SiC is the oxygen partial pressure on

a specimen surface estimated by the diffusion

  • equation. The heat transfer and the heat balance

caused by radiation, convection and reaction heat in a reaction tube were calculated by the numerical

  • method. Fig.4 shows the temperature gradient in the

reaction tube of Cahn D-101 under steady temperature distribution. As shown in this figure, gas temperature around a specimen almost consistent with that of the tube. Thus, the heat transfer between the gas and the tube converged to zero at the steady state. Between the gas and the SiC surface, there was a slight difference of about 10℃ in Cahn D-101 and also TGD. The reaction rate decreased by 0.9% compared with the case that all temperature was constant and uniform. Therefore, the thermal gradient in an apparatus was assumed to contribute only slightly in the following calculations. This result also indicates that the wide variation of APT shown in Fig.1 and also that of the active

  • xidation rate are not caused by these factors.

4.3 The oxygen partial pressure on the specimen Fig.5 shows PO2 distribution for the Cahn D-101 (a) and TGD (b). The oxygen partial pressures near the SiC surfaces for the apparatuses differ seriously, because of difference in the diffusion and flow of

  • xygen.

Fig.6 represents the

  • xygen

partial pressures on SiC surfaces (PO2)s for two types of thermo-balances, Cahn R-100 and TGD under the same gas flow rate of 0.0243m/s. It should be noted in this figure that (PO2)s of the Cahn D-101 and TGD are more than one order of magnitude lower than

  • xygen partial pressure in input gas, and (PO2)s of

the Cahn D-10a is about 3 times higher than that of

  • TGD. From these results, it was concluded that the
  • xidation rate of SiC cannot be properly evaluated

unless oxygen partial pressure on the SiC surface (PO2)s is determined.

0.1 1 10 5 5.1 5.2 5.3 5.4 5.5

Temperature (K)

1850 1900 1950

Active Oxidation Rate ( 10

  • 5 kg/m

2・s

  • 1)

1/T ×10

4 (1/K) Cahn D-101 Experiment v=0.0243m/s Cahn D-101 Experiment v=0.0134m/s Cahn D-101 Analysis v=0.0243m/s Cahn D-101 Anslysis v=0.0134m/s

Fig.3. Observed and calculated oxidation rates are compared to justify calculation conditions for Cahn D-101 model at PO2=50Pa. Fig.4. Temperature distributions for Cahn D- 101 (a) at 1980 K PO2=50Pa, v=2.43×10-

3m/s.

slide-4
SLIDE 4

0.5 1 1.5 2 5 5.05 5.1 5.15 5.2 5.25 5.3 5.35 5.4 Cahn D-101 TGD

Active Oxidation Rate ( 10

  • 5 kg/m

2・s

  • 1)

1/T×10

4 (1/K)

Temperature (K)

1980 1940 1900 1860

Fig.7. Difference of active oxidation rates evaluated using Cahn-100 and TGD at 1923K, PO2=50Pa, v=2.43×10⁻²m/s. 4.2 The oxidation rate Fig.7 shows the oxidation rates as a function of 1/T obtained using ANSYS/FLUENT for the Cahn D-101 and TGD. Fig.7 indicates that the oxidation rate obtained using the Cahn D-101 was about 3 times higher than that of the TGD, and the oxygen partial pressure on the specimen surface of the Cahn D-101 is also 3 times higher than that of the TGD. This result shows that the contribution of the temperature distribution is slight. Therefore, the

  • xygen partial pressure on the SiC surface was an
  • nly factor causing the device dependence of the
  • xidation rate.

5 Conclusions The reported oxidation rates of SiC were expressed as a function of input partial pressure of oxygen. This study shows that oxidation rate should be expressed as a function of partial pressure of oxygen

  • n the specimen surface (PO2)S. The large scattering

shown in the introduction of this paper in terms of the oxidation rates and the transition conditions of active-to-passive oxidation regimes is very likely due to misevaluation of the partial pressure of

  • xygen PO2; input PO2 in the present case is 5~60

times as high as (PO2)S. From these results, it is concluded that the active oxidation rates and the transition condition of active-to-passive oxidation cannot be quantitatively evaluated unless precisely identification of the oxidation environments, in particular the oxygen partial pressure on the SiC surface (PO2)S.

References

[1] T. Narushima, T. Goto, Y. Iguchi and T.Hirai, 1991, “High-Temperature Oxidation of Silicon Carbide- Passive/Active oxidation and Bubble Formation”, J.

  • Am. Ceramic. Soc., 74[10], pp.2583-2586

[2] T. Goto and T, Hirai, 1996, “High-Temperature Oxidation of CVD Silicon-Based Ceramics”, J. Am.

  • Ceramic. Soc., 71, pp.245-257

[3] E. Oshima, 1970, NCID-BN01298140, in Japanese, pp.25-37

Fig.5. The distributions of oxygen partial pressure for (a) Cahn D-101 and (b) TGD at 1980 K, PO2=50Pa, v=2.43×10⁻³m/s.

0.1 1 10 100 5 5.05 5.1 5.15 5.2 5.25 5.3 5.35 5.4

Cahn D-101 TGD The input oxygen

Temperature (K)

1980 1940 1900 1860

Oxidation Partial Pressure (Pa) 1/T ×10

4 (1/K)

Fig.6. Comparison of oxygen partial pressures on SiC surface between Cahn-100 and TGD, when the concentrations of input oxygen are the same at PO2=50Pa, v=2.43×10⁻³m/s.