Accident Sequence Quantification in Multi-unit Seismic PSA using MCSs - - PDF document

accident sequence quantification in multi unit seismic
SMART_READER_LITE
LIVE PREVIEW

Accident Sequence Quantification in Multi-unit Seismic PSA using MCSs - - PDF document

Transactions of the Korean Nuclear Society Virtual Spring Meeting July 9-10, 2020 Accident Sequence Quantification in Multi-unit Seismic PSA using MCSs Yongjin Kim, Seunghyun Jang, Moosung Jae* Department of Nuclear Engineering, Hanyang


slide-1
SLIDE 1

Accident Sequence Quantification in Multi-unit Seismic PSA using MCSs

Yongjin Kim, Seunghyun Jang, Moosung Jae* Department of Nuclear Engineering, Hanyang University, Seoul, 04763, Korea *Corresponding Author: jae@hanyang.ac.kr

  • 1. Introduction

The accident sequence probability in nuclear power plant PSA (Probabilistic Safety Assessment) is required to make link between the levels of PSA. The REA (Rare Event Approximation) and MCUB (Minimal Cutsets Upper Bound) quantification for the sequences have been commonly applied to internal event PSA model with fault trees when cutsets are derived. But, in case of dealing with earthquake, the assumption made to apply REA may not able to be implemented because high probability of SSCs (System, Structure and Component) failure should be considered. Additionally, as simultaneous core damage of more than 1 unit is likely to happen in extreme condition, the different approach is required for quantification. In Korea, the tools are invented to solve such a problem, FTeMC (Fault Tree top event probability Evaluation using Monte Carlo simulation) with SiTER (Splitter and Integrator for Total Estimation of Site Risk) program and BeEAST (Boolean Equation Evaluation Analysis and Sensitivity Tool) [1,2]. FTeMC is able to give accident sequence probability using Monte Carlo simulation. To utilize designated cutset information which FTeMC does not produce, the truncation limit need to be considered. Also, to quantify the probability of accident sequences in case of external event with BeEAST, the cutsets and the result that BeEAST prints out need to be treated additionally to consider the success probabilities. In this study, cutset modification and multi-unit consideration (CMMC) method for accident sequence quantification is proposed to utilize the cutsets and BeEAST program for quantification. The quantification results derived by FTeMC and the CMMC methods with BeEAST are compared using pilot multi-unit seismic PSA model built as an example. Also, the quantification result of multi-unit options equipped in BeEAST program also compared.

  • 2. Method

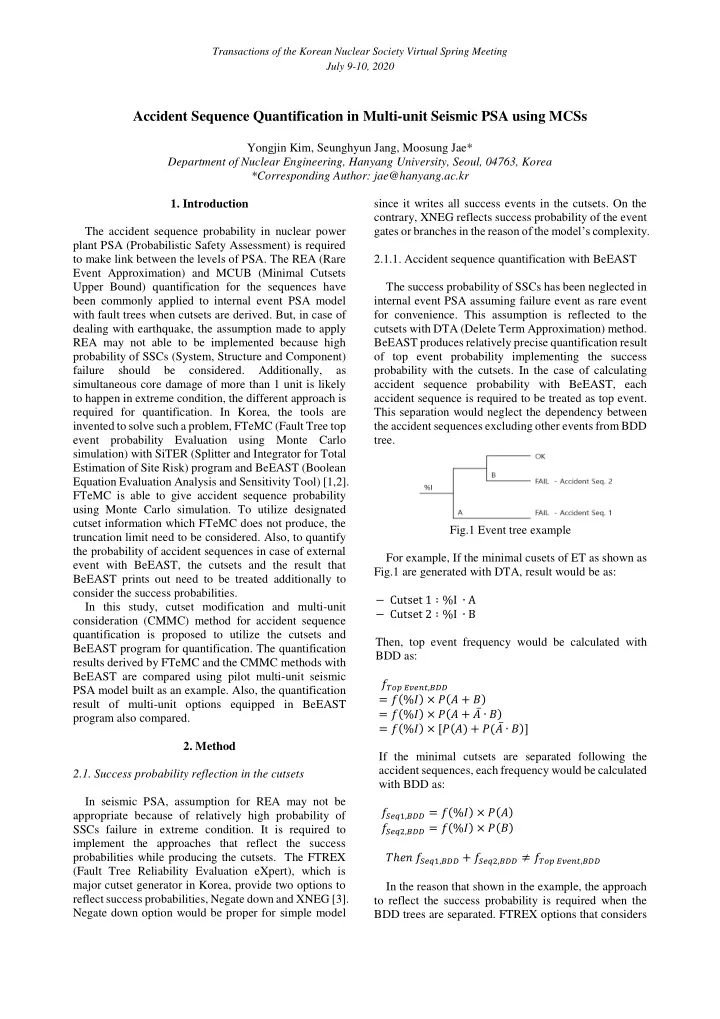
2.1. Success probability reflection in the cutsets In seismic PSA, assumption for REA may not be appropriate because of relatively high probability of SSCs failure in extreme condition. It is required to implement the approaches that reflect the success probabilities while producing the cutsets. The FTREX (Fault Tree Reliability Evaluation eXpert), which is major cutset generator in Korea, provide two options to reflect success probabilities, Negate down and XNEG [3]. Negate down option would be proper for simple model since it writes all success events in the cutsets. On the contrary, XNEG reflects success probability of the event gates or branches in the reason of the model’s complexity. 2.1.1. Accident sequence quantification with BeEAST The success probability of SSCs has been neglected in internal event PSA assuming failure event as rare event for convenience. This assumption is reflected to the cutsets with DTA (Delete Term Approximation) method. BeEAST produces relatively precise quantification result

  • f top event probability implementing the success

probability with the cutsets. In the case of calculating accident sequence probability with BeEAST, each accident sequence is required to be treated as top event. This separation would neglect the dependency between the accident sequences excluding other events from BDD tree. Fig.1 Event tree example For example, If the minimal cusets of ET as shown as Fig.1 are generated with DTA, result would be as: − Cutset 1 ∶ %I ∙ A − Cutset 2 ∶ %I ∙ B Then, top event frequency would be calculated with BDD as: 𝑔

𝑈𝑝𝑞 𝐹𝑤𝑓𝑜𝑢,𝐶𝐸𝐸

= 𝑔(%𝐽) × 𝑄(𝐵 + 𝐶) = 𝑔(%𝐽) × 𝑄(𝐵 + 𝐵̅ ∙ 𝐶) = 𝑔(%𝐽) × [𝑄(𝐵) + 𝑄(𝐵̅ ∙ 𝐶)] If the minimal cutsets are separated following the accident sequences, each frequency would be calculated with BDD as: 𝑔

𝑇𝑓𝑟1,𝐶𝐸𝐸 = 𝑔(%𝐽) × 𝑄(𝐵)

𝑔

𝑇𝑓𝑟2,𝐶𝐸𝐸 = 𝑔(%𝐽) × 𝑄(𝐶)

𝑈ℎ𝑓𝑜 𝑔

𝑇𝑓𝑟1,𝐶𝐸𝐸 + 𝑔 𝑇𝑓𝑟2,𝐶𝐸𝐸 ≠ 𝑔 𝑈𝑝𝑞 𝐹𝑤𝑓𝑜𝑢,𝐶𝐸𝐸

In the reason that shown in the example, the approach to reflect the success probability is required when the BDD trees are separated. FTREX options that considers

Transactions of the Korean Nuclear Society Virtual Spring Meeting July 9-10, 2020

slide-2
SLIDE 2

success probability can help to solve this problem by writing the cutsets with success events additionally. 2.1.2. Cutset generation considering seismic PSA model structure The seismic PSA model in Korea that has been developed is shown briefly in Fig. 2 [4,5]. The model can be divided into primary ET (Event Tree), which considers seismically induced major failures, and secondary ET that is for random failure events. It is also able to consider seismically induced failure in secondary ET if it is needed. Comparing with these two ETs, the primary ET is relatively simple since SSCs in the ET are restricted and secondary ET considers the numerous number of random failure events. So, to reflect the success probability in seismic PSA model, the Negate down and XNEG option would be appropriate for primary and secondary ET respectively.

  • Fig. 2. Analysis method for domestic nuclear power plant

seismic PSA [5] Then, if the options are applied to produce the cutsets, it would be written as shown in Fig. 3. The whole event that considered by Negate down option would be written in the cutset. And the success events in secondary ET would be grouped by a small number of groups.

  • Fig. 3. Cutset modification for seismic PSA model

structure to reflect success events 2.2. Multi-unit site consideration Further treatment to the accident sequence probability calculated by BeEAST is required to reflect unit success probability in case of multi-unit site. In case of the PSA model considers 2-unit site, the probability calculated by 1 unit cutset through BDD process can be decomposed as:

P(𝑉𝑏) = P(𝑉𝑏 ∙ 𝑉𝑐 + 𝑉𝑏 ∙ 𝑉𝑐 ̅ ̅ ̅ ̅) = P(𝑉𝑏 ∙ 𝑉𝑐) + 𝑄(𝑉𝑏 ∙ 𝑉𝑐 ̅ ̅ ̅ ̅)

If REA is applicable, the probability that only a-unit fails can be considered as:

𝑄(𝑉𝑏 ∙ 𝑉𝑐 ̅ ̅ ̅ ̅) ≈ 𝑄(𝑉𝑏) (∵ 𝑄(𝑉𝑐 ̅ ̅ ̅ ̅) ≈ 1)

If it is not, the probability of 2-unit failure needs to be deducted from the probability of only a-unit failure.

𝑄(𝑉𝑏 ∙ 𝑉𝑐 ̅ ̅ ̅ ̅) ≉ 𝑄(𝑉𝑏) (∵ 𝑄(𝑉𝑐 ̅ ̅ ̅ ̅) ≉ 1)

This phenomenon occurs because the cutsets in case

  • f multi-unit PSA does not contain the information of the

success of certain unit. BeEAST provides the extra multi-unit option to overcome this problem in unit level. But the option in the levels of accident sequences is not realized. To consider unit success cases in accident sequence level with BeEAST result, calculation had been conducted with some principle below: 1. The dependency exist between accident sequences

  • f certain unit is considered to be solved in the

cutset generation process establishing exclusive

  • relation. Then all the accident sequences probability
  • f certain unit can be simply added to calculate the

total probability. e.g.) P(SU1,1 + SU1,2) = P(SU1,1) + P(SU1,2) 2. In certain combination of accident sequences, it is assumed that each conditional probability is

  • independent. Consequently, it makes calculation

expressing combination simple and the formula with MCUB form. The system to calculate the probability

  • f

combinations would be straightforward only utilizing certain number of unit failure group and the group that 1 more-unit failed. e.g.) P(SU1.a/SU2.b/SU3.c) = P(SU1.a) – P(SU1.a·SU2.b) – P(SU1.a·SU3.c) + P(SU1.a·SU2.b·SU3.c) ≈ P(SU1.a) – P(SU1.a) · P

𝑏(SU2.b) – P(SU1.a)·P 𝑏 (SU3.c)

+ P(SU1.a) ·P

𝑏 (SU2.b) ·P 𝑏 (SU3.c)

≈ P(SU1.a)[1 – P

𝑏 (SU2.b)][1 – P 𝑏 (SU3.c)]

The dependency of sequences between the units may exist. But if that is caused by random failure, it would be negligibly small. In seismic correlation in extreme condition, large number of unit failure would be dominant and the error occurred through this process is expected to be small. Even if the dependencies are expected to be small, the values of conditional probability (e.g. P

𝑏 (SU2.b)) dealt in

calculation can be different. So, it should be segregated by the combinations. The inclusion-exclusion calculation had been tried, but some result showed negative values. Truncation limit applied to the cutset generation is expected to be the cause.

Transactions of the Korean Nuclear Society Virtual Spring Meeting July 9-10, 2020

slide-3
SLIDE 3

The pilot multi-unit seismic PSA model is utilized to compare the performance of calculation methods. The pilot model is developed considering 4 units based on seismic PSA methodology in Korea and the inter-unit dependency methodology of Park et. al. (2019) with additional seismic correlated failure between the units calculated by COREX (Correlation Explicit) [7, 8]. The range of PGA (Peak Ground Acceleration) is divided into 6 parts, 0.1g ~ 0.2g (0.15g), 0.2g ~ 0.4g (0.3g), 0.4g ~ 0.6g (0.5g), 0.6g ~ 0.8g (0.7g), 0.8g ~ 1.0g (0.9g), 1.0g ~. Each result of the ranges calculated by the 3 methods is compared.

  • 3. Result and Discussion

The accident sequence probabilities of pilot multi-unit seismic PSA model in each designated range by FTeMC and BeEAST with the CMMC methods are calculated. Additionally, the quantification result of BeEAST with multi-unit option is also suggested. BeEAST 1.2, FTeMC 2.1, SiTER 1.0b and FTREX 2.0 are used in this

  • paper. The conditional probabilities are shown as the

result to compare the performances of the qualification

  • methods. The cutset is generated with the truncation limit
  • f 10-13/yr. The number of sampling with FTeMC is set

to be 60 million, which is computer performance limit, for each range respectively. The number of major cutset for BeEAST with multi-unit method set to be as high as possible or sum of minor cutset results to be occupied 5%

  • f the total frequency and only Negate down option is

applied because BeEAST recognizes the effect of the

  • ption.

Table Ⅰ. Total Conditional probability of pilot multi-unit seismic PSA model in each earthquake range by the 3 methods FTeMC with SiTER CMMC BeEAST with Multi-unit option 0.15g 1.14.E-03 1.16.E-03 1.17.E-03 0.3g 1.24.E-01 1.25.E-01 1.27.E-01 0.5g 9.07.E-01 9.01.E-01 9.55.E-01 0.7g 1.00.E+00 9.96.E-01 1.07.E+00 0.9g 1.00.E+00 1.00.E+00 1.02.E+00 1.0g ~ 1.00.E+00 1.00.E+00 1.00.E+00

Each total conditional probability calculated by 3 methods showed relatively similar values. The result of FTeMC showed very slightly higher value than the one

  • f the CMMC method. In 0.7g and 0.9g range, the result
  • f BeEAST with multi-unit option exceed 1.0 and in 0.5g

range, BeEAST evaluated the probability higher than

  • thers. It is expected that the reason is the BDD size was

not enough to include the whole cutsets by the lack of the computer performance. For example, in 0.5g range, the cutsets of 4-unit failure sequences are not included in BDD tree generally and calculated with MCUB. If the result is decomposed in the level of plants or accident sequences, the quantification difference between the methods could be found. In the plant level, following Fig. 3, BeEAST with multi-unit option gives result that is higher than others in non-dominant cases because computer performance and BDD tree was not enough to contain whole cutsets. In contrast, the CMMC method could treat almost every cutsets except a few accident sequences in 0.3g range. FTeMC and the propose method showed relatively similar value. But in 0.15 range, FTeMC could not show the result of 4-unit failure even though other methods could. It is expected that sampling was not enough and it is expected that It needs 500 million samples to give the results, which

  • verwhelms the computer performance equipped.
  • Fig. 4. Distribution of conditional probability failure arranged

by the number of unit failure

In the level of accident sequences, the quantification difference was found that it grows bigger if the level of dominance by accident sequence probability gets low

  • relatively. In other words, if the probability of the

accident sequence is dominant, the results calculated by two methods are very alike. The result of Table Ⅰ could be acquired by the same reason. The ratio of the result calculated with CCMC method to the one with FTeMC is shown in Fig. 5, arranged by the level dominance of the accident sequence probability. The level of dominance is calculated with the result of FTeMC.

1.00E-10 1.00E-08 1.00E-06 1.00E-04 1.00E-02 1.00E+00

1 Unit 2 Units 3 Units 4 Units

0.15g

1.00E-08 1.00E-06 1.00E-04 1.00E-02 1.00E+00

1 Unit 2 Units 3 Units 4 Units

0.3g

1.00E-04 1.00E-02 1.00E+00

1 Unit 2 Units3 Units4 Units

0.5g

1.00E-04 1.00E-02 1.00E+00

1 Unit 2 Units 3 Units 4 Units

0.7g

1.00E-04 1.00E-02 1.00E+00

1 Unit 2 Units 3 Units 4 Units

0.9g

FTeMC with SiTER BeEAST Multi-unit option Proposed Method

Transactions of the Korean Nuclear Society Virtual Spring Meeting July 9-10, 2020

slide-4
SLIDE 4
  • Fig. 5. Distribution of the ratio of the accident sequence

probability calculation with FTeMC (60 million samples each) and the CMMC method arranged by the level of accident sequence dominancy.

In 0.15g range, the number of accident sequences are not enough to show the trend. But, in other cases, the trend that the level of dominance gets bigger, the results

  • f two result showed similar value is observable. The

results of dominant sequences seem to be valid.

  • 4. Conclusions

In seismic PSA model with fault trees, FTeMC with SiTER program and BeEAST with cutsets can be utilized for quantification. But to use the cutsets with designated truncation limit in case

  • f

accident sequence quantification with BeEAST, the additional treatment is required based on the characteristic of the model. Also the current version of BeEAST could not give accident sequence probability. By reflecting the success of events and the unit, the proposed method could give comparable value with the result of FTeMC with SiTER program and BeEAST with multi-unit option. The proposed method broke the size of the BDD tree down to relatively small

  • ne and could cover almost every cutsets. But FTeMC

demanded very large number of sample, which

  • verwhelms the limit of the computer performance

equipped, to give rare probability of certain accident

  • sequence. And the BeEAST with multi-unit option

demanded enormous size of BDD tree which also

  • verwhelms

the equipment performance. The advancement of the computer and program would give better qualification result. But, as a compromise, the CMMC method can be appropriate way. If the improvement of BeEAST that makes it to deal with accident sequence probability in the cutsets level and break down the size of BDD tree, it would be recommended. ACKNOWLEDGEMENT This work was supported by the Nuclear Safety Research Program through the KOFONS (Korea Foundation Of Nuclear Safety), granted financial resource from the MURRG (Multi-Unit Risk Research Group), Republic of Korea (No. 1705001). REFERENCES

[1] S.H Han and H.G Lim, Top event probability evaluation of a fault tree having circular logics by using Monte Carlo method, Nuclear Engineering and Design 243, pp. 336-340, 2012 [2] W.S Jung. BeEAST Version 1.1 User Manual, Sejong University, 2017. [3] W.S. Jung, et al., A Fast BDD algorithm for large coherent fault trees analysis, Reliability Engineering and System Safety,

  • Vol. 83, Issue 2, pp. 369-374, March 1, 2004

[4] Korea Hydro and Nuclear Power Co. Shin Kori 1,2 unit Full-Power External Event Level 1 PSA, 2015. [5] H.K. Lim. A Study of System Analysis Method for Seismic PSA of Nuclear Power Plants, Journal of the Korean Society of Safety, Vol. 34, No. 5, pp. 159-166, Oct 2019. [6] W.S Jung. FTREX Features for a Multi-unit PSA, Transactions of the Korean Nuclear Society Spring Meeting, Jeju, Korea, May 17-18, 2018. [7] S.H. Park, et al., A Preliminary Site Risk Assessment for the Reference Site in Korea, Transactions of the Korean Nuclear Society Autumn Meeting, Ilsan, Korea, Oct 23-25, 2019. [8] W.S Jung. How to Convert Correlated Seismic Failures into Seismic CCFs, Transactions of the Korean Nuclear Society Spring Meeting, Jeju, Korea, May 23-24, 2019. [9] Han, S.H., Lim, H.G., Yang, J.E., AIMS-PSA: A Software for Integrating Various Types of PSA, PSAM9, 2008. [10] H.G. Lim, D.S. Kim, S. H. Han and J.E Yang, Development of logical structure for multi-unit probabilistic safety assessment, Nuclear Engineering and Technology, Vol. 50, pp. 1210-1216, 2018.

0.01 0.1 1 10 100 1.E-05 1.E-04 1.E-03 1.E-02 1.E-01 1.E+00

Ratio Dominancy 0.15g

0.1 1 10 100 1.E-07 1.E-06 1.E-05 1.E-04 1.E-03 1.E-02 1.E-01 1.E+00

Ratio Dominancy 0.3g

0.01 0.1 1 10 100 1.E-08 1.E-07 1.E-06 1.E-05 1.E-04 1.E-03 1.E-02 1.E-01 1.E+00

Ratio Dominancy 0.5g

0.001 0.01 0.1 1 10 100 1000 1.E-08 1.E-06 1.E-04 1.E-02 1.E+00

Ratio Dominancy 0.7g

0.001 0.01 0.1 1 10 100 1000 1.E-08 1.E-07 1.E-06 1.E-05 1.E-04 1.E-03 1.E-02 1.E-01 1.E+00

Ratio Dominancy 0.9g

Transactions of the Korean Nuclear Society Virtual Spring Meeting July 9-10, 2020