
The UNIVERSITY of NORTH CAROLINA at CHAPEL HILL
Backscatter and Global Analysis Stefan Zota
Analyze tcpdump logs and get global abnormal traffic Gather vanilla statistics:
Port classification traffic Destination and Source address traffic Classification of the I CMP error messages (TTL field, port unreachable, fragmentation needed, echo reply for echo request floods) Percent of successful connections and connection based bit rate and packet rate stats Average duration and interval for malicious connections
The UNIVERSITY of NORTH CAROLINA at CHAPEL HILL
Attacks
Top attack sources Unsuccessful TCP connections
SYN attacks TCP RST ACK backscatter
DNS lookup and ping messages to check if we have spoofed inexistent sources Look at the destination I P over fixed time-windows. Event based classification
Intrusion Detection with Honeypots
Claire O’Shea
Setup
Using honeyd to monitor 14 IP addresses in
the CS department
Behind campus IDS, but not department
firewalls
All incoming packets are logged 1 week of passive monitoring 1 week of emulating services (in progress) FTP server Telnet SMTP server Web server
Intrusion Detection with Honeypots
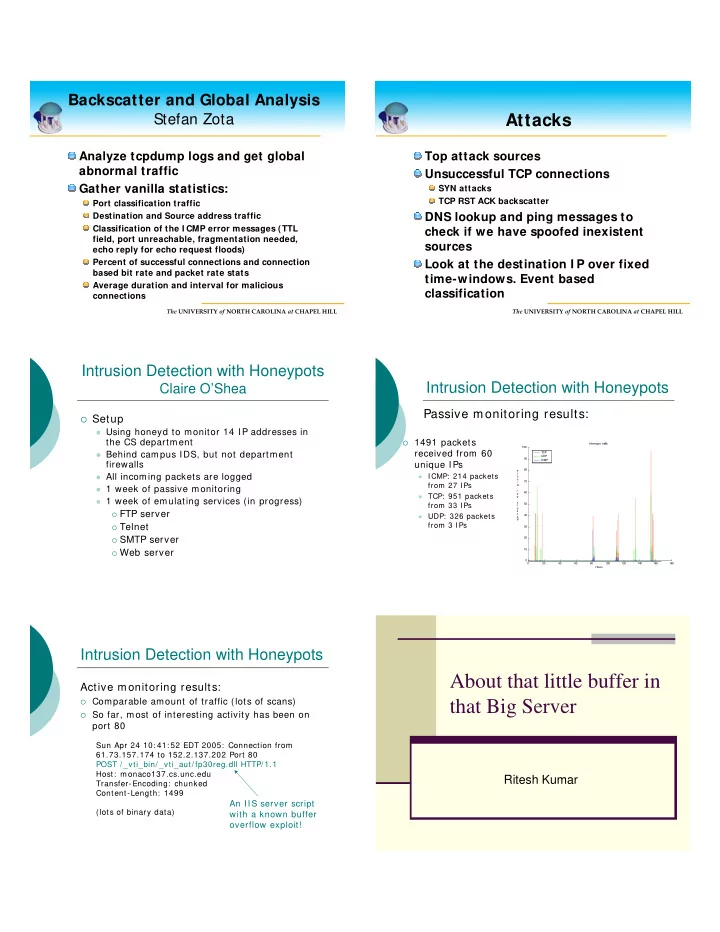
1491 packets
received from 60 unique IPs
ICMP: 214 packets
from 27 I Ps
TCP: 951 packets
from 33 I Ps
UDP: 326 packets
from 3 I Ps
20 40 60 80 100 120 140 160 180 10 20 30 40 50 60 70 80 90 100 Honeypot traffic Hours P a c k e t s p e r m i n u t e TCP UDP ICMP
Passive monitoring results:
Intrusion Detection with Honeypots
Active monitoring results:
Comparable amount of traffic (lots of scans) So far, most of interesting activity has been on
port 80
Sun Apr 24 10: 41: 52 EDT 2005: Connection from 61.73.157.174 to 152.2.137.202 Port 80 POST / _vti_bin/ _vti_aut/ fp30reg.dll HTTP/ 1.1 Host: monaco137.cs.unc.edu Transfer-Encoding: chunked Content-Length: 1499 (lots of binary data)
An IIS server script with a known buffer
- verflow exploit!