
SLIDE 1
10/29/18 1 Quantitative Literacy and Global Warming
www. www.globalwa warmingprimer.com Jeff Bennett jeff@bigkidscience.com
Quantitative Literacy and Global Warming
Key Connections:
- Logic and critical thinking
- Data interpretation and visualization
- Mathematical modeling
- Economic considerations
- Probability/Risk Analysis
- …
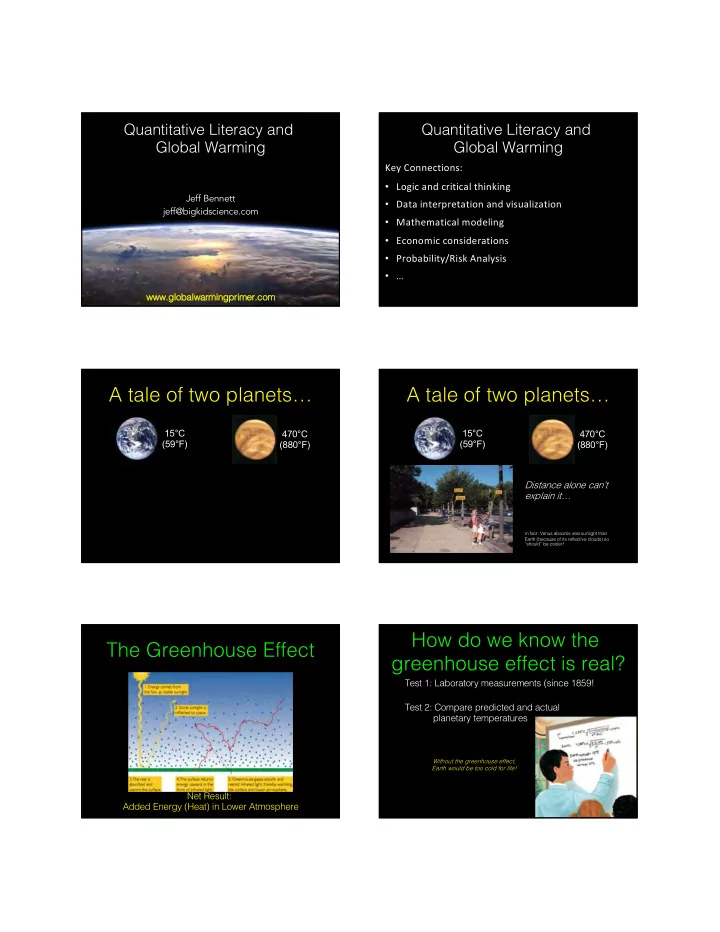
A tale of two planets…
470°C (880°F) 15°C (59°F)
A tale of two planets…
470°C (880°F) 15°C (59°F) Distance alone can’t explain it…
In fact: Venus absorbs less sunlight than Earth (because of its reflective clouds) so “should” be cooler!The Greenhouse Effect
Net Result: Added Energy (Heat) in Lower Atmosphere
How do we know the greenhouse effect is real?
Test 1: Laboratory measurements (since 1859! Test 2: Compare predicted and actual planetary temperatures
Without the greenhouse effect, Earth would be too cold for life!