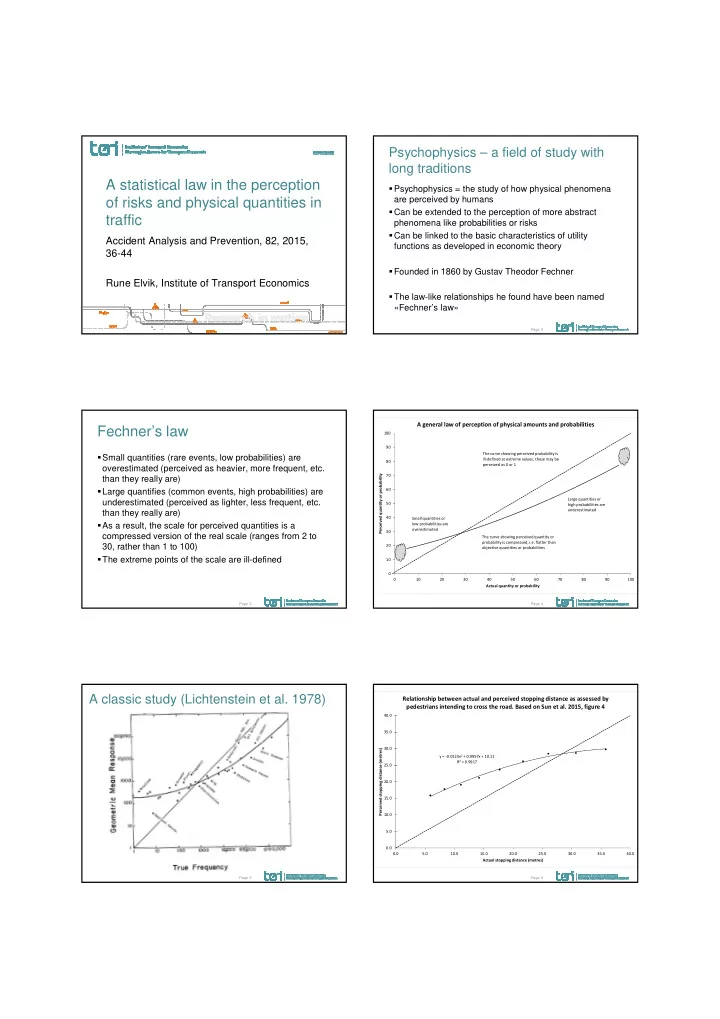

A statistical law in the perception
- f risks and physical quantities in
traffic
Accident Analysis and Prevention, 82, 2015, 36-44 Rune Elvik, Institute of Transport Economics
Page
Psychophysics – a field of study with long traditions
Psychophysics = the study of how physical phenomena are perceived by humans Can be extended to the perception of more abstract phenomena like probabilities or risks Can be linked to the basic characteristics of utility functions as developed in economic theory Founded in 1860 by Gustav Theodor Fechner The law-like relationships he found have been named «Fechner’s law»
2 Page
Fechner’s law
Small quantities (rare events, low probabilities) are
- verestimated (perceived as heavier, more frequent, etc.
than they really are) Large quantifies (common events, high probabilities) are underestimated (perceived as lighter, less frequent, etc. than they really are) As a result, the scale for perceived quantities is a compressed version of the real scale (ranges from 2 to 30, rather than 1 to 100) The extreme points of the scale are ill-defined
3 Page 4
10 20 30 40 50 60 70 80 90 100 10 20 30 40 50 60 70 80 90 100 Perceived quantity or probability Actual quantity or probability
A general law of perception of physical amounts and probabilities
Small quantities or low probabilities are
- verestimated
Large quantities or high probabilities are underestimated The curve showing perceived quantity or probability is compressed, i.e. flatter than
- bjective quantities or probabilities
The curve showing perceived probability is ill-defined at extreme values; these may be perceived as 0 or 1
Page
A classic study (Lichtenstein et al. 1978)
5 Page 6
y = -0.0123x2 + 0.9957x + 10.11 R² = 0.9917 0.0 5.0 10.0 15.0 20.0 25.0 30.0 35.0 40.0 0.0 5.0 10.0 15.0 20.0 25.0 30.0 35.0 40.0 Perceived stopping distance (metres) Actual stopping distance (metres)
Relationship between actual and perceived stopping distance as assessed by pedestrians intending to cross the road. Based on Sun et al. 2015, figure 4