
SLIDE 1
SU SUPERVISO SORS: S: Associate Professor J
- nathan Binns, Professor Kiril Tenekedjiev, Dr. Rouzbeh Abbassi, Dr. Vikram G
araniya, Michael Lonsdale
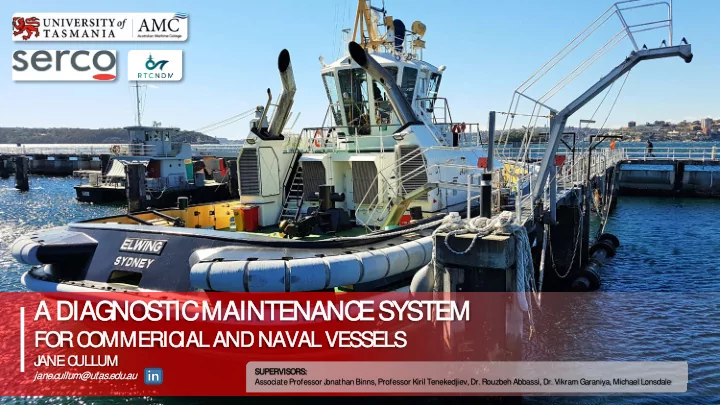
A DIAG NO NOSTIC MAINT NTENA NANC NC E SYSTEM
FOR C C OMMERIC IAL A L AND N D NAVAL L VESSELS LS
J ANE C C ULLU LLUM
jane ne.cul ullum um@ut utas.edu. u.au