9/5/2016 Department of Large Animal Sciences Department of Large - - PDF document

9 5 2016
SMART_READER_LITE
LIVE PREVIEW

9/5/2016 Department of Large Animal Sciences Department of Large - - PDF document

9/5/2016 Department of Large Animal Sciences Department of Large Animal Sciences Outline The decision making process The role of models From registration to information, I Basic production monitoring as a source of information Key figures


slide-1
SLIDE 1

9/5/2016 1

From registration to information, I

Anders Ringgaard Kristensen

Department of Large Animal Sciences

Outline

The decision making process The role of models Basic production monitoring as a source of information Key figures and their properties Interpretation of key figures Limitations of traditional production monitoring

Department of Large Animal Sciences Slide 2

Focus of this lecture

In last lecture, we discussed:

  • Planning, classical

approach

In this lecture we direct our attention towards the other side of the management cycle:

  • Production monitoring

We shall, however, try to look at it from a decision making perspective.

Making decisions

Decision making is based on knowledge:

  • General knowledge: What you can read in a textbook on

animal nutrition, animal breeding, agricultural engineering etc.

  • Context specific knowledge: What relates directly to the

unique decision problem. Examples:

  • The milk yield of dairy cow No. 678 when considered for

culling.

  • The estrus status of sow No. 345 when considered for

insemination.

  • The current daily gain of the slaughter pigs in House 5

when considering whether or not to adjust protein contents of the diet.

When knowledge is represented in a form that may be used directly as basis for a decision, we call it information.

Department of Large Animal Sciences Slide 4

Information sources

General knowledge:

  • Look in a textbook
  • Ask an expert

Context specific knowledge:

  • Obtained through registrations (observations) in the

herd:

  • Traditional registrations
  • Test day milk yield, cow 567
  • Litter size of sow 123
  • Sensor based registrations
  • Conductivity or temperature of milk from AMS
  • Accelerations of a sow from a censor node in

an ear tag

  • Computer vision (image analysis)

Department of Large Animal Sciences Slide 5

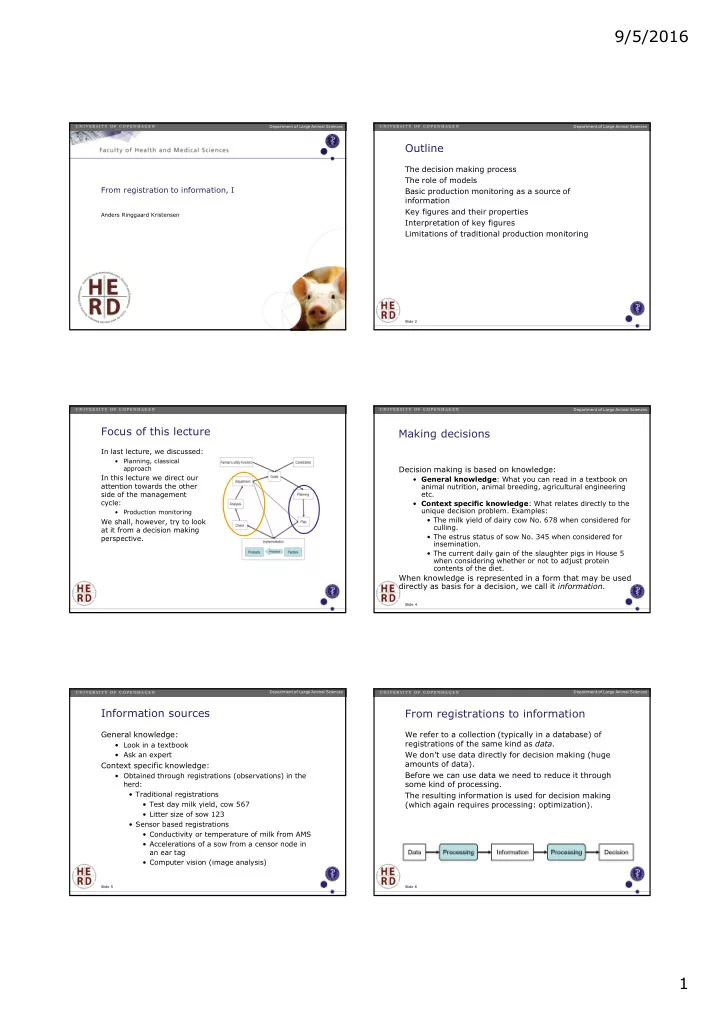
From registrations to information

We refer to a collection (typically in a database) of registrations of the same kind as data. We don’t use data directly for decision making (huge amounts of data). Before we can use data we need to reduce it through some kind of processing. The resulting information is used for decision making (which again requires processing: optimization).

Department of Large Animal Sciences Slide 6

slide-2
SLIDE 2

9/5/2016 2

A simple example of the path

Data: Test day milk yields Processing I: Calculating cumulated yields for individual cows over a standardized period and afterwards calculating the herd average. Information: Average milk yield in the herd. Processing II: Linear programming using the Simplex algorithm. Decision: Least cost feed ration for the cows. The path from test day milk yields to feed ration is not unique:

  • Both processing steps could be replaced by other methods.
  • Choosing a wise processing of data into information is an

important issue in herd management!

Department of Large Animal Sciences Slide 7

Cécile Cornou, LC-2373, IPH, KVL

Advanced example: Hogthrob

Activity Measurements – in Group Housed Pen

  • Accelerometer fitted on neck collar
  • Acceleration in 3 dimensions
  • Four measurements per second
  • Transfer PC via Blue Tooth
  • Gestation house and farrowing crate

Video Recordings

  • Four cameras used as web cam

Department of Large Animal Sciences Slide 8

The Farrowing House

Data Collected – Farrowing house

Farrowing

Department of Large Animal Sciences Slide 10

Activity Classification – Farrowing

2 days before farrowing

Feeding: 7.15, 12.00, 15.30 Lying side 1 Lying side 2 Lying sternally Active

Department of Large Animal Sciences Slide 11

Activity Classification – Farrowing

Farrowing day

Lying side 1 Lying side 2 Lying sternally Active Feeding / Rooting / Nesting

Department of Large Animal Sciences Slide 12

slide-3
SLIDE 3

9/5/2016 3

Information retrieval – Farrowing (or heat)

Department of Large Animal Sciences Slide 13

An advanced example of the path: Hogthrob

Data: Accelerations of a sow measured 4 times per second in 3 dimensions Processing I: Online time series analysis of the acceleration data using Dynamic Linear Models Information: Sow in heat? (yes/no). [Example: farrow] Processing II: Dynamic programming. Decision: Inseminate/leave open/cull Notice the reduction in the dimensionality of the information (one binary variable) compared to the data!

Department of Large Animal Sciences Slide 14

The decision making process: Summary

The purpose of monitoring is to improve the decisions Processing of registrations into information is necessary Choosing the best processing is a key issue Information is a tractable representation of context specific knowledge. Monitoring is the sub-path from registration to information During this course we will follow the path from data to decision:

Department of Large Animal Sciences Slide 15

Uncertain information

Classical methods assume certainty. In real life, certain information hardly exists. However, the degree of uncertainty varies. In general, we use distributions for representation

  • f knowledge with uncertainty.

For binary information, we may just supply the probability. For continuous information, we supply for instance a normal distribution with a mean and a variance. A small variance implies that we are rather certain about the value. For consistent processing of data, a model is needed.

Department of Large Animal Sciences Slide 16

Uncertainty: Pregnancy status of a cow

For the replacement decision we want to know the pregnancy status of a cow, but it is (most often) unobservable, so we have only indirect observations:

  • If a cow has not been inseminated, the probability of

pregnancy is zero.

  • If it has been inseminated, the probability is 0.4,

because the conception rate of the herd is 0.4.

  • If, after 5 weeks, the cow has not shown heat, the

probability increases. Assuming a heat detection rate of 0.5, the probability increases to 0.7.

  • A positive pregnancy diagnosis will further increase the

probability, but only a calving will increase it to 1.

We need a method for consistently combining the indirect observations into an updated probability of pregnancy. We may use a Bayesian Network model for that!

Department of Large Animal Sciences Slide 17

Models for monitoring under uncertainty

Assessing the distribution of a key figure from the distribution of data (later this lecture):

  • “Black box” approach

Statistical quality control models based on time series analysis:

  • More or less “black box” approach

Dynamic Linear Models based on Bayesian updated time series with Kalman filtering:

  • Structured model
  • Data of same kind

Bayesian networks

  • Highly structured models
  • Data from different sources

Department of Large Animal Sciences Slide 18

slide-4
SLIDE 4

9/5/2016 4

Basic production monitoring

Traditional approach to production monitoring:

  • Registrations are collected systematically in the herd
  • Data is entered into a Management Information

System (MIS).

  • At quarterly (or monthly) intervals, the MIS

calculates a bunch of key figures which are presented to the farmer in tabular form in report.

  • The farmer looks at the key figure and decides

whether or not to make adjustments to production.

The information provided is the list of key figures. We shall briefly discuss how to interpret such key figures in a sound way.

Department of Large Animal Sciences Slide 19

Focus on the monitoring process

Department of Large Animal Sciences Slide 20

Principles of production monitoring

Data recording Database Data processing Report with key figures Analysis

  • Statistical
  • Utility

Decision

Department of Large Animal Sciences Slide 21

Data recording

Events:

  • Mating
  • Farrowing
  • Weaning

Department of Large Animal Sciences Slide 22

A record (or ”registration”)

Event (mating/farrowing/weaning …) Identification (sow #/section #/batch #) Registration level (animal/section/batch/herd) Time (date or date/hour/minute) Property (what is measured) Value (numerical or categorical)

Department of Large Animal Sciences Slide 23

A record, example

Event: Farrowing Identification: Sow # 1234 Registration level: Animal Time: February 23rd Property: Live born piglets Value: 12

Department of Large Animal Sciences Slide 24

slide-5
SLIDE 5

9/5/2016 5

Principles of production monitoring Data recording Database Data processing Report with key figures Analysis

  • Statistical
  • Utility

Decision

Department of Large Animal Sciences Slide 25

Records: Collect in a table

Basically a table for each event, but several properties

  • Example: Farrowing

Sow # Date Liveborn Stillborn Course 1234 15/1 04 12 2 Easy 678 16/1 04 9 4 Diff. 1001 18/1 04 14 1 Easy … … … … …

Database

A collection of tables for different events

Sow # Date Liveborn Stillborn Course 1234 15/1 04 12 2 Easy 678 16/1 04 9 4 Diff. 1001 18/1 04 14 1 Easy … … … … …

Principles of production monitoring Data recording Database Data processing Report with key figures Analysis

  • Statistical
  • Utility

Decision

Department of Large Animal Sciences Slide 28

Data processing

Ask questions to the database (the SQL language):

  • Number of events in a period
  • Matings per week: #matings/#weeks
  • Farrowings per week: #farrowings/#weeks
  • Averages over a period
  • Liveborn piglets per litter

Department of Large Animal Sciences Slide 29

Data processing: Complex, I

Total gain, slaughter pigs (this period):

  • + Total weight, slaughtered pigs
  • + Total weight, dead pigs
  • + Valuation weight, end
  • – Total weight, inserted pigs
  • – Valuation weight, beginning

Daily gain = Total gain / Total days in feed Data sources?

Department of Large Animal Sciences Slide 30

slide-6
SLIDE 6

9/5/2016 6

Principles of production monitoring

Data recording Database Data processing Report with key figures Analysis

  • Statistical
  • Utility

Decision

Department of Large Animal Sciences Slide 31

Interdependencies

Key figures are heavily correlated:

  • Logically (refer

to figure)

  • Biologically

Report with key figures

Key figures have 3 basic properties

  • Correctness
  • Are all registrations correct (right animal(s),

right event, right value etc.)?

  • Validity
  • Does the key figure express exactly what we

want to know?

  • Precision
  • Standard deviation of estimate – Exercise.

Department of Large Animal Sciences Slide 33

Correctness

Examples …

Department of Large Animal Sciences Slide 34

Validity

Example: Reproduction in sows Discussion:

  • What do you want to know?
  • Which figure(s) will provide us with the desired

information?

Department of Large Animal Sciences Slide 35

Key figure: Farrowings per week

Utilization of the farrowing department. One of the most important elements from an economical point of view. Presented as an average value. What is of interest is the distribution over weeks.

Department of Large Animal Sciences Slide 36

slide-7
SLIDE 7

9/5/2016 7

Principles of production monitoring

Data recording Database Data processing Report with key figures Analysis

  • Statistical
  • Utility

Decision

Department of Large Animal Sciences Slide 37

Precision

Formal definition. The precision ρ is defined as ρ = 1/σ2 where σ is the standard deviation of the calculated key figure. Let κ be a calculated key figure. We may model κ as follows κ =θ + es + eo , Where

  • θ is the true (unobservable) underlying value
  • es is the sample error (the ”biological” variation)
  • eo is the observation error (depends on the method)
  • σ2 = V(es) + V(eo)

We should regard κ as the estimated value of θ, where σ is the standard deviation of the estimate

Department of Large Animal Sciences Slide 38

Precision, statistical evaluation

Farrowing percentage The percentage of matings resulting in a farrowing (sold pregnant sows are excluded from the calculations). Assume that 90 % was expected, but the calculated key figure was 87 %. Should we be worried?

Department of Large Animal Sciences Slide 39

Farrowing percentage, I

How many matings are included in the calculation? Assume N. If the expected value is p = 90 %, we want to test the null hypothesis H0: p = 0.90 The number of matings, n, resulting in a farrowing will be binomially distributed with the parameters p = 0.90 and N.

Department of Large Animal Sciences Slide 40

Farrowing percentage, II

Assume that there is no observation error, i.e. V(eo) = 0. The variance of n is equal to the sample variance, which (in a binomial distribution) is: σ2 = Np(1-p) = N × 0.90 × 0.10 = 0.09N

Department of Large Animal Sciences Slide 41

Farrowing percentage, III

Evaluation of the result given N

N σ2 σ n Exp. Dev. Dev./σ 100 9 3 87 90 3 1.0 200 18 4.2 174 180 6 1.4 300 27 5.2 261 270 9 1.7 400 36 6.0 348 360 12 2.0*

slide-8
SLIDE 8

9/5/2016 8

Principles of production monitoring

Data recording Database Data processing Report with key figures Analysis

  • Statistical
  • Utility

Decision

Department of Large Animal Sciences Slide 43

Utility evaluation

If a deviation is significant from a statistical point

  • f view it should also be evaluated from a utility

point of view. Far more difficult than the statistical evaluation! Example: Does it matter that the pregnancy rate is lower than expected? An obvious tool for utility evaluation is a simulation model.

Department of Large Animal Sciences Slide 44

Limitations of traditional monitoring

Dependence on defined targets (expected results). Most often, the precision of the key figures is not calculated. Correlations between key figures are typically ignored. Autocorrelations over time are typically ignored. The processing of data into information is very simple (even though it may be computationally demanding) with loss of information as a consequence. Acknowledgement: Slides 8-13 provided by Cécile Cornou

Department of Large Animal Sciences Slide 45