6/21/2019 Air pollution Financial disclosures Air Pollution: Every - - PDF document

6 21 2019
SMART_READER_LITE
LIVE PREVIEW

6/21/2019 Air pollution Financial disclosures Air Pollution: Every - - PDF document

6/21/2019 Air pollution Financial disclosures Air Pollution: Every Breath You Take 1. Overview, effects on indigenous populations. None. Christopher Sanford, MD, MPH, DTM&H Christopher Sanford, MD Associate Professor, Family Medicine,


slide-1
SLIDE 1

6/21/2019 1

Air Pollution: Every Breath You Take

Christopher Sanford, MD, MPH, DTM&H Associate Professor, Family Medicine, Global Health University of Washington, Seattle, WA, USA Terry Gordon, PhD Professor of Environmental Medicine New York University School of Medicine, New York, NY, USA

  • Dr. Trish Batchelor, FRACGP MPH (Trop Med) Dip CH ACCAM PG Dip Occ Env

Med Chief Medical Officer, DFAT Australia CISTM16, Washington DC, June 2019

Air pollution

  • 1. Overview, effects on indigenous populations.

Christopher Sanford, MD

  • 2. Study on travelers and pulmonary function

Terry Gordon, PhD

  • 3., Managing pollution in expatriates: developing

a strategy and practical tips for travellers. Trish Batchelor, MD

Financial disclosures

  • None.

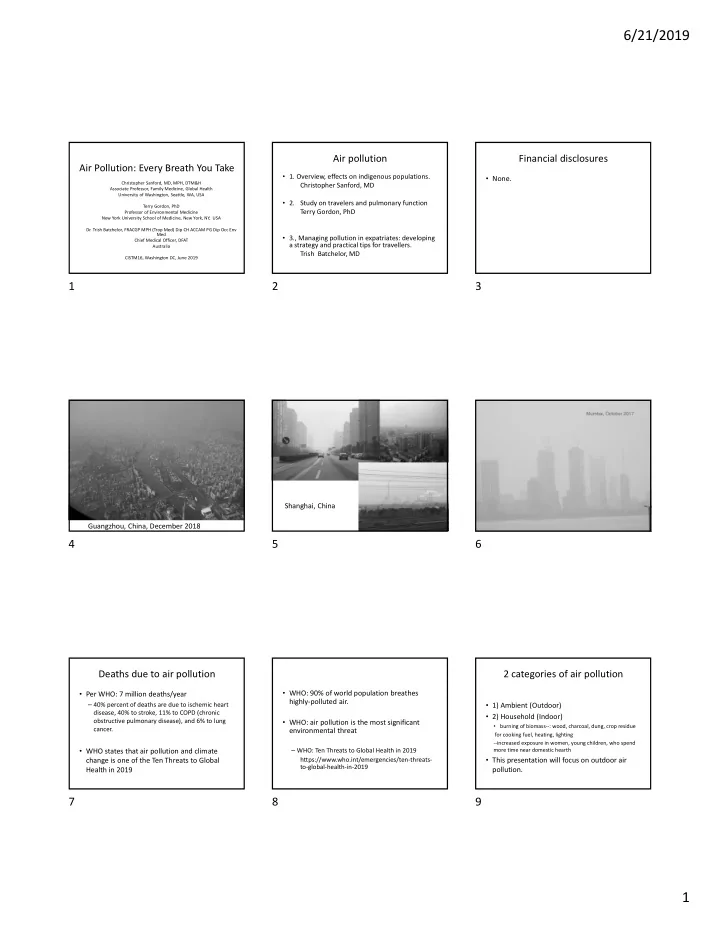
Guangzhou, China, December 2018 Shanghai, China

Deaths due to air pollution

  • Per WHO: 7 million deaths/year

– 40% percent of deaths are due to ischemic heart disease, 40% to stroke, 11% to COPD (chronic

  • bstructive pulmonary disease), and 6% to lung

cancer.

  • WHO states that air pollution and climate

change is one of the Ten Threats to Global Health in 2019

  • WHO: 90% of world population breathes

highly‐polluted air.

  • WHO: air pollution is the most significant

environmental threat

– WHO: Ten Threats to Global Health in 2019 https://www.who.int/emergencies/ten‐threats‐ to‐global‐health‐in‐2019

2 categories of air pollution

  • 1) Ambient (Outdoor)
  • 2) Household (Indoor)
  • burning of biomass‐‐: wood, charcoal, dung, crop residue

for cooking fuel, heating, lighting ‐‐increased exposure in women, young children, who spend more time near domestic hearth

  • This presentation will focus on outdoor air

pollution.

1 2 3 4 5 6 7 8 9

slide-2
SLIDE 2

6/21/2019 2

A problem in both low‐ and high‐ income nations.

  • Over 90% of deaths related to air pollution
  • ccur in low‐income nations.

India, China

  • India and China account for over 50% of

deaths due to air pollution.

  • Of the 25 cities with the worst air pollution, 20

are in India.

Top 100 cities in the world, air pollution, PM2.5

  • China: 57
  • India: 33
  • Pakistan: 2
  • Bahrain: 1
  • Bosnia‐Herzegovina: 1
  • United Arab Emirates: 1
  • Nepal: 1
  • Bangladesh: 1
  • Afghanistan: 1
  • Mongolia: 1
  • Kuwait: 1

AirVisual, 2018 https://www.airvisual.com/world‐most‐polluted‐cities

Increasingly, travelers are visiting regions with significant air pollution.

  • 2017: 1.32 billion tourist arrivals globally

1990 2015 World 435 million 1.186 billion Advanced economies 299 million 653 million Emerging economies 136 million (31%) 533 million (45%)

‐‐UNWTO 2016a

International Tourist Arrivals

  • Many areas with significant air pollution are

seeing a marked increase in visitors, e.g., India.

– 10.04 million tourist arrivals in India in 2017, a 17% increase over the previous year.

  • India Tourist Statistics at a Glance: 2018. Ministry of

Tourism, Government of India. http://tourism.gov.in/sites/default/files/Other/ ITS_Glance_2018_Eng_Version_for_Mail.pdf

Health effects of air pollution

  • stroke
  • heart disease
  • sudden death
  • COPD (chronic obstructive pulmonary disease)
  • asthma
  • lung cancer
  • other cancers: breast, bladder, liver, pancreas,

bile duct, and gall bladder

  • In addition to effects on heart and lung function,

air pollution has been linked to decreased cognitive function and increased crime.

  • A large study performed in multiple cities in

China linked long‐term air pollution to impaired math and verbal skills; effects were greatest in

  • lder men with lower educational levels (see

article by Zhang et al in References).

Different ways to measure air pollution

  • 1) Air quality index. (AQI).
  • Level of pollutant, via a piecewise linear

function, is converted to a number on a scale

  • n which values below 100 are good or

moderate.

  • If multiple pollutants are measured at a

monitoring site, then the largest or "dominant" AQI value is reported for the location

Air Quality Index (AQI)

10 11 12 13 14 15 16 17 18

slide-3
SLIDE 3

6/21/2019 3

2) Specific pollutants

  • PM2.5
  • PM10
  • ozone level
  • etc.

US Clean Air Act

  • Requires EPA (Environmental Protection

Agency) to set National Ambient Air Quality Standards (NAAQS).

  • NAAQS are currently set for six “Criteria Air

Pollutants.”

The EPA (Environmental Protection Agency) lists six “Criteria Air Pollutants”

  • Particulate matter (PM)

– PM2.5 – PM10

  • Ozone (ground‐level)
  • Carbon monoxide
  • Nitrogen dioxide
  • Sulfur dioxide
  • Lead

EPA (Environmental Protection Agency) Criteria Air Pollutants, https:// www.epa.gov/criteria‐air‐pollutants accessed 9 May 2019

Particulate matter

  • Particulate matter (PM)

– PM2.5 – PM10

  • Suspended solid or liquid matter
  • Source:

– Anthropogenic—burning fossil fuels – Natural—dust storms, fires

Why does size matter?

23

Particulate matter

  • Decreases lung function.
  • Increases risk of sudden death.
  • Lung CA (IARC [Int’l Agency for Research on

Cancer] Group 1 carcinogen)

  • Worsens asthma.

Particulate matter, 2013 study

  • 312,944 people, in nine European countries
  • no safe level of particulates
  • for every increase of 10 μg/m3 in PM10,

the lung cancer rate rose 22%.

  • smaller PM2.5 ‐‐stronger correlation‐‐ 36%

increase in lung cancer per 10 μg/m3

– Raaschou‐Nielsen O, et al. Air pollution and lung cancer incidence in 17 European cohorts: prospective analyses from the European Study of Cohorts for Air Pollution Effects (ESCAPE) Lancet Oncol. 2013;14(9):813–822.

PM2.5

Schulz J., et al. Adressing Global Mortality from PM 2.5, Environmental Science & Technology, 2015.

PM2.5, standards (in μg/m3)

WHO EU US India daily PM2.5 μg/m3 25 35 40 annual PM2.5 μg/m3 10 25 12 60

19 20 21 22 23 24 25 26 27

slide-4
SLIDE 4

6/21/2019 4

Ground‐level ozone (O3)

  • (Not to be confused with “good ozone,” which is in the

stratosphere 10‐50 km [6‐31 miles] above the earth).

  • Created by chemical reactions between oxides of

nitrogen (NOx) and volatile organic compounds (VOC)

  • Occurs when pollutants emitted by cars, power plants,

industrial boilers, refineries, chemical plants, etc. chemically react in the presence of sunlight.

US EPA. Ground‐level ozone basics https://www.epa.gov/ground‐level‐ozone‐pollution/ground‐level‐ozone‐basics Accessed 9 May 2019

Ground‐level ozone (O3) (cont.)

  • Causes chest pain, coughing, throat irritation,

and airway inflammation

  • Reduces lung function.
  • Worsens bronchitis, emphysema, asthma.

Ozone and relative mortality rate

Jerrett, et al. Long‐Term Ozone Exposure and Mortality. N Engl J Med 2009; 360:1085‐1095.

Carbon monoxide (CO)

  • Released when something is burned.
  • Greatest sources of CO to outdoor air: cars,

trucks and other vehicles or machinery that burn fossil fuels.

Carbon monoxide (CO) (cont.)

  • Reduces the amount of oxygen that blood can

transport

  • At low concentrations:

– Can cause fatigue in healthy people – Can exacerbate angina in those with heart disease

Nitrogen dioxide (NO2)

  • “Nitrogen dioxide (NO2) is one of a group of highly

reactive gases known as oxides of nitrogen or nitrogen oxides (NOx). Other nitrogen oxides include nitrous acid and nitric acid. NO2 is used as the indicator for the larger group of nitrogen oxides.”

  • NO2 is produced by burning of fuel: emissions from

cars, trucks and buses, power plants, and off‐road equipment.

US EPA. Basic Information about NO2 https://www.epa.gov/no2‐pollution/basic‐information‐about‐ no2#What%20is%20NO2 Accessed 9 May 2019

Nitrogen dioxide (cont.)

  • Aggravates respiratory diseases, including

asthma.

  • Long‐term exposure elevates risk of asthma,

and increases susceptibility to respiratory illnesses.

  • At increased risk for health effects of NO2:

children, the elderly, those with asthma.

Sulfur dioxide

  • SO2 is the sulfur oxide (SOx) of greatest concern

and is used as the indicator for the larger group

  • f gaseous sulfur oxides
  • Sources:

– primary: burning of fossil fuels by power plants and

  • ther industrial facilities

– lesser: industrial processes such as extracting metal from ore; natural sources such as volcanoes; and locomotives, ships and other vehicles and heavy equipment that burn fuel with a high sulfur content.

US EPA. Sulfur Dioxide (SO2) Pollution https://www.epa.gov/so2‐pollution/sulfur‐dioxide‐basics#what%20is%20so2 Accessed 9 May 2019

Sulfur dioxide (cont.)

  • Associated with respiratory symptoms and disease,

difficulty in breathing, and premature death

  • People with asthma, particularly children, are sensitive to

these effects of SO2.

  • High concentrations of SO2 lead to the formation of other

sulfur oxides (SOx) which can react with compounds in the atmosphere to form particulate matter (PM)

  • Environmental: Contributes to acid rain.
  • At high concentrations, gaseous SOx can harm trees and

plants by damaging foliage and decreasing growth.

28 29 30 31 32 33 34 35 36

slide-5
SLIDE 5

6/21/2019 5

Lead

  • Sources of environmental lead: use of fossil fuels including

past use of leaded gasoline, some types of industrial facilities, and past use of lead‐based paint in homes

  • Countries that continue to use lead in gasoline: Algeria, Iraq,

Yemen, Myanmar, North Korea, & Afghanistan. Algiers, Algeria

Leaded gas in US phased

  • ut 1970s‐1995.

Lead (cont.)

  • Adversely affects:
  • nervous system

– behavior and learning problems – lower IQ

  • Kidneys
  • Hampers immunity.
  • Children and pregnant women at increased

risk.

What do pretravel providers talk about?

  • Primarily: infectious diseases.
  • Travelers’ deaths:
  • ~50%: MI and CVA
  • ~ 25% road traffic injuries
  • Common: Drowning, falls from heights, homicide,

suicide.

  • Only 1‐2% of traveler’s deaths due to ID causes.
  • Is air pollution related to sudden death in

travelers?

  • Little research on deaths in travelers due to MI

and CVA.

  • Why does the travel medicine community not

address the most common cause of death in travelers?

  • Data is on residents, not travelers.
  • Minimal research on travelers to date.
  • Ruzmyn Vilcassim, Terry Gordon, et al, study.

– Terry Gordon—will discuss.

The role of the pre‐travel provider.

  • Short‐term:
  • Most young healthy people: symptoms are

minor; irritating but not dangerous.

  • People with chronic pre‐existing medical

conditions

– COPD – Asthma – CAD

  • Trish Batchelor to discuss.
  • Are masks of benefit?

Masks: proven benefit:

  • 1) surgeons/surgical staff

Masks: proven benefit:

  • 2) bank robbers

37 38 39 40 41 42 43 44 45

slide-6
SLIDE 6

6/21/2019 6

Masks: proven benefit:

  • 3) superheroes

What about travelers?

  • Benefit is less clear.
  • Surgical masks: useless. Fashion accessories.

CDC on masks and travelers:

  • No recommendation.
  • “The decision to wear a mask should be left to

the traveler’s discretion.”

CDC: Health Information for International Travelers Chapter 2: The Pretravel Consultation. Environmental Hazards Armin Ansari, Suzanne Beavers https://wwwnc.cdc.gov/travel/yellowbook/2018/ the‐pre‐travel‐consultation/environmental‐hazards accessed 28 April 2019

  • Trish Batchelor

will discuss masks and air purifiers in more detail N95 mask

Regulation works

  • Mexico City in 1992: worst air pollution in the

world.

  • Now markedly better. In 2012, ozone and
  • ther pollutants, about the same level as Los

Angeles.

  • For PM2.5, not in top (worst) 500 cities in the

world.

Mexico City: strategies

  • Tightened regulations on fuel and cars.
  • Authorities moved factories out of the capital.
  • Invested in new sustainable buses and new bus

routes.

  • Invested in a public bicycle access program.
  • Hoy No Circula, or “No‐Drive Days,” prohibited

drivers from using their vehicles one weekday per week, with a schedule based on license‐plate numbers.

– In 2008, this system was expanded to include Saturdays.

Los Angeles

  • Downtown

Los Angeles 1968

Los Angeles

  • Large population
  • Large number of cars
  • Large number of trucks

– (Port of Long Beach, Port of Los Angeles, biggest container port in the US, diesel trucks)

  • Sunny days
  • Inland mountains

Los Angeles

  • catalytic converter—mandatory as of 1975 in CA
  • vehicle inspections
  • starting in 1970, US gov’t phased out leaded gas
  • emissions limits on industries
  • regulating open burning in garbage dumps
  • controls to reduce hydrocarbon emissions from

industrial gasoline storage tanks, gasoline tank trucks and underground storage tanks at service stations

  • citrus growers, smudge pots, cleaner fuels

46 47 48 49 50 51 52 53 54

slide-7
SLIDE 7

6/21/2019 7

Los Angeles: Still polluted, but better, despite increased population, more cars, more trucks.

Ozone in Los Angeles

  • 1976‐80: average of 112 Stage 1 ozone alerts

per year

  • None since 2003

– (Stage 1 alert: when ozone is over 20 parts per million.)

  • A study that looked at asthma levels in

children in Southern California between 1993 and 2014 found a correlation between declining ambient nitrogen dioxide and PM2.5 levels, and a reduced incidence of asthma.

  • Garcia E, et al. Association of Changes in Air Quality

With Incident Asthma in Children in California, 1993‐

  • 2014. JAMA. 2019;321(19):1906‐1915.

doi:10.1001/jama.2019.5357. 21 May 2019.

Advocacy

  • Physicians can and should be advocates for

cleaner air.

  • Terry Gordon will discuss the role of advocacy.
  • The bigger issue is not the effect of air

pollution on travelers, but air pollution on native populations.

  • However, data on travelers may be of value in

research on native populations.

References

  • Ambient Air Quality Standards in India
  • http://www.arthapedia.in/index.php?title=Ambient_Air_Quality_Standards_in_In

dia

  • accessed 27 May 2019
  • CDC: Health Information for International Travelers, Chapter 2: The Pretravel
  • Consultation. Environmental Hazards, Armin Ansari, Suzanne Beavers
  • https://wwwnc.cdc.gov/travel/yellowbook/2018/the‐pre‐travel‐

consultation/environmental‐hazards

  • accessed 28 April 2019
  • CNN. Top 100 most polluted cities in 2018,
  • https://www.cnn.com/2019/03/05/health/100‐most‐polluted‐cities‐2018‐

intl/index.html

  • Garcia E, et al. Association of Changes in Air Quality With Incident Asthma in

Children in California, 1993‐2014. JAMA. 2019;321(19):1906‐1915. doi:10.1001/jama.2019.5357. 21 May 2019.

  • India Tourist Statistics at a Glance: 2018. Ministry of Tourism, Government of India.
  • http://tourism.gov.in/sites/default/files/Other/ITS_Glance_2018_Eng_Version_for

_Mail.pdf

References (cont.)

  • Jerrett, et al. Long‐Term Ozone Exposure and Mortality. N Engl J Med 2009;

360:1085‐1095.

  • Pope III, C.A., Burnett, R.T., Turner, M.C., Cohen, A., Krewski, D., Jerrett, M.,

Gapstur, S.M. and Thun, M.J., 2011. Lung cancer and cardiovascular disease mortality associated with ambient air pollution and cigarette smoke: shape of the exposure–response relationships. Environmental health perspectives, 119(11), pp.1616‐1621.

  • Raaschou‐Nielsen O, Andersen ZJ, Beelen R, Samoli E, Stafoggia M, Weinmayr G,

Hoffmann B, Fischer P, Nieuwenhuijsen MJ, Brunekreef B, et al. Air pollution and lung cancer incidence in 17 European cohorts: prospective analyses from the European Study of Cohorts for Air Pollution Effects (ESCAPE) Lancet

  • Oncol. 2013;14(9):813–822.
  • Vilcassim R, Gordon T, Sanford C. Does Air Pollution Contribute to Travelers' Illness

and Deaths? ‐ Evidence from a Case Report and Need For Further Studies. Jo. Travel Medicine. Volume 25, Issue 1, Jan. 2018.

Acknowledgements

  • Ruzmyn Vilcassim
  • Terry Gordon
  • Trish Batchelor
  • Gerard Flaherty
  • Photo Credits

– Guangzhou: Curt Sanford – Shanghai: Sheila Mackell’s brother – Mumbai, Algiers: Christopher Sanford

55 56 57 58 59 60 61 62