
6/19/2019 1
To vaccinate or not?
Efficacy and safety of vaccines, as wellas the increased need, in the older traveller
Mark P . Walberg, Pharm.D., Ph.D., CTH Associate Professor of PharmacyPractice University of the Pacific Thomas J.Long Schoolof Pharmacyand HealthScience
Financial Disclosures
- Mark P. Walberg, PharmD, PhD, CTH discloses the followingrelationships:
- Previously employed as a paid speaker for Merck Vaccines
- Currently retained as a paid legal consultant for Merck Vaccines
- Currently employed byGlaxoSmithKline
- This conflict has been resolved per ACPE best practices
The questions we willask…
- Is there really a need for vaccination in older adults?
- What does an optimal immune response look like?
- What evidence is there for a decreased response to vaccines in older
adults?
- What can be done to improve the efficacyof vaccines in older adults?
Thegoal of this talkis not to explicitlydescribewhat happenswith vaccines givento older adults, but to provide a framework for how all vaccines work across the lifespan of the patient and how to optimize them. The vaccines we have today will hopefully be obsolete in the future when they are replaced by betterversions or the diseases are eradicated.
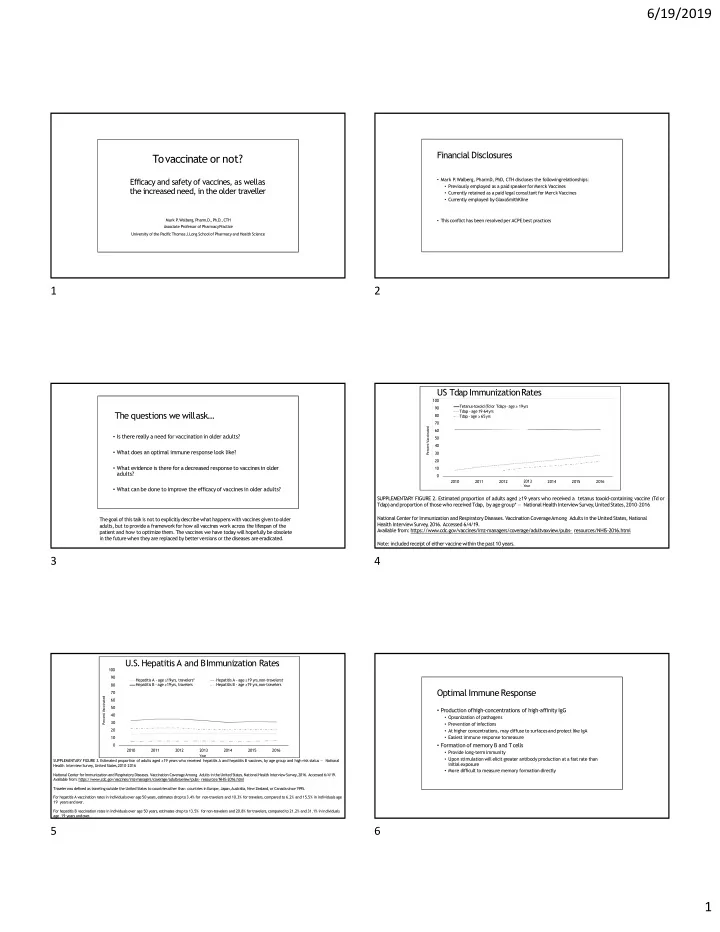
90 80 70 60 50 40 30 20 10 100 2010 2011 2012 2014 2015 2016 Tetanus-toxoid (Td or Tdap) - age ≥ 19yrs Tdap - age 19-64yrs Tdap - age ≥ 65yrs
US Tdap ImmunizationRates
Percent Vaccinated
2013
Year
SUPPLEMENTARY FIGURE 2. Estimated proportion of adults aged ≥19 years who received a tetanus toxoid-containing vaccine (Td or Tdap)and proportion of those who receivedTdap, by age group* — National Health InterviewSurvey ,UnitedStates,2010–2016 National Center for Immunization and RespiratoryDiseases. Vaccination CoverageAmong Adults in the United States,National Health InterviewSurvey ,2016. Accessed 6/4/19. Available from: https://www .cdc.gov/vaccines/imz-managers/coverage/adultvaxview/pubs- resources/NHIS-2016.html Note: includedreceipt of either vaccine withinthe past 10 years.
U.S. Hepatitis A and BImmunization Rates
90 80 70 60 50 40 30 20 10 100 2010 2011 2012 2014 2015 2016 Hepatitis A - age ≥19yrs, travelers* Hepatitis B - age ≥19yrs, travelers Hepatitis A - age ≥19 yrs,non-travelers† Hepatitis B - age ≥19 yrs,non-travelers
Percent Vaccinated
2013
Year SUPPLEMENTARY FIGURE 3. Estimated proportion of adults aged ≥19 years who received hepatitis A and hepatitis B vaccines, by age group and high-risk status — National Health InterviewSurvey,United States,2010–2016 National CenterforImmunizationand RespiratoryDiseases. Vaccination CoverageAmong Adults inthe UnitedStates,National Health InterviewSurvey,2016. Accessed 6/4/19. Available from: https://www.cdc.gov/vaccines/imz-managers/coverage/adultvaxview/pubs- resources/NHIS-2016.html Travelerwas defined as traveling outside the UnitedStates to countriesother than countriesinEurope, Japan,Australia, New Zealand,or Canadasince1995. Forhepatitis A vaccination rates inindividualsover age50 years,estimates dropto 3.4% for non-travelers and 10.3% for travelers, compared to 6.2% and 15.5% in individuals age 19 years andover. For hepatitis B vaccination rates in individuals over age 50 years, estimates drop to 13.5% for non-travelers and 20.8% fortravelers,comparedto 21.2% and 31.1% in individuals age 19 years andover.
Optimal ImmuneResponse
- Production ofhigh-concentrations of high-affinity IgG
- Opsonization of pathogens
- Prevention of infections
- At higher concentrations, may diffuse to surfacesand protect like IgA
- Easiest immune response tomeasure
- Formation of memory B and Tcells
- Provide long-term immunity
- Upon stimulation will elicit greater antibody production at a fast rate than
initial exposure
- More difficult to measure memory formation directly