5 Million OZ Targeting GOLD EQUIVALENT MINERALIZED DOMAINS USED - - PowerPoint PPT Presentation

5 million oz
SMART_READER_LITE
LIVE PREVIEW

5 Million OZ Targeting GOLD EQUIVALENT MINERALIZED DOMAINS USED - - PowerPoint PPT Presentation

5 Million OZ Targeting GOLD EQUIVALENT MINERALIZED DOMAINS USED FOR EXPLORATION TARGET, MINERAL INVENTORY AND MODELLED PIT SHELLS ON GROUND MAGNETICS Mine Portal AGB Mine Portal DUKES RIDGE PHOENIX PHOENIX EAST 100% Owned GOLD SILVER


slide-1
SLIDE 1

GOLD SILVER PROJECT

5 Million OZ GOLD EQUIVALENT

Targeting

100% Owned

April 2020

TSX/V : BNCH OTCQB : CYRTF WKN : A2JM2X

PHOENIX EAST PHOENIX DUKE’S RIDGE AGB MINERALIZED DOMAINS USED FOR EXPLORATION TARGET, MINERAL INVENTORY AND MODELLED PIT SHELLS ON GROUND MAGNETICS Mine Portal Mine Portal

slide-2
SLIDE 2

2

TSX/V : BNCH | OTCQB : CYRTF | WKN : A2JM2X

Disclaimer

Forward Looking Statements:

Certain statements and/or graphics in the Company’s press releases, web site information and corporate displays, among others, constitute “forward-looking statements”. These statements are based on information currently available to the Company and the Company provides no assurance that actual results will meet management’s expectations. Forward-looking statements include estimates and statements that describe the Company’s future plans, objectives or goals, including words to the effect that the Company or management expects a stated condition or result to occur. Forward-looking statements may be identified by terms such as “believes”, “anticipates”, “expects”, “estimates”, “may”, “could”, “would”, “will”, or “plan”, or their conditional or future forms. Since forward-looking statements are based on assumptions and address future events and conditions, by their very nature they involve inherentrisks and uncertainties. Actual results relating to, among other things, results of exploration, project development, reclamation and capital costs of the Company’s mineral properties, and the Company’s financial condition and prospects, could differ materially from those currently anticipated in such statements for many reasons such as: changes in general economic conditions and conditions in the financial markets ; changes in demand and prices for minerals ; litigation, legislative, environmental and other judicial, regulatory, political and competitive developments; technological and operational difficulties encountered in connection with the activities of the Company; and other matters discussed in this presentation. This list is not exhaustive of the factors that may affect any of the Company’s forward-looking statements. These and other factors should be considered carefully and readers should not place undue reliance on the Company’s forward-looking statements. The Company does not undertake to update any forward looking statement that may be made from time to time by the Company or on its behalf, except if required to do so by applicable securities laws. You are cautioned not to place any undue reliance on any forward-looking statement.

Forward Looking Statements or Information Related to Exploration:

Relating to exploration, the identification of exploration targets and any implied future investigation of such targets on the basis of specific geological, geochemical and geophysical evidence or trends are future-looking and subject to a variety of possible outcomes which may or may not include the discovery, or extension, or termination of

  • mineralization. Further, areas around known mineralized intersections or surface showings may be marked by wording such as “open”, “untested”, “possible extension” or

“exploration potential” or by symbols such as “?”. Such wording or symbols should not be construed as a certainty that mineralization continues or that the character of mineralization (e.g. grade or thickness) will remain consistent from a known and measured data point. The key risks related to exploration in general are that chances of identifying economical reserves are extremely small. The presentation contains historical exploration data that have not been verified by Benchmark Metals Inc. and may not be accurate or complete, and therefore the information should notbe relied upon. Michael Dufresne, M.Sc., P.Geol., P.Geo., an independent director of the Company, also serves as a Technical Advisor and is the Qualified Person, as defined by National Instrument 43- 101, responsible forreviewing and approving the technical content of all materials publicly disclosed by Benchmark,including the contents ofthis presentation.

slide-3
SLIDE 3

3

TSX/V : BNCH | OTCQB : CYRTF | WKN : A2JM2X

Benchmark Metals Inc. is a mineral exploration company focused on proving and developing the substantial resource potential of the Lawyer’s Gold and Silver project, located in the prolific Golden Horseshoe of northern British Columbia, Canada. Benchmark is a member of the Metals Group of Companies, and is led by a dynamic group of resource sector professionals with a long track record of success in evaluating and advancing mining projects from exploration through to production, attracting capital and overcoming adversity to deliver exceptional shareholder value

About Benchmark Metals Inc.

LAWYERS GOLD & SILVER PROJECT VANCOUVER

slide-4
SLIDE 4

4

TSX/V : BNCH | OTCQB : CYRTF | WKN : A2JM2X

50 100 150 200 250 300 350 MARKET CAPITALIZATION ($ MILLIONS) LAWYERS PROJECT

  • 100 % owned
  • Located in the prolific Golden Horseshoe
  • Developing substantial resource potential
  • Past producer with ~$50 million in existing infrastructure
  • Proven and profitable mining jurisdiction

CATALYSTS FOR GROWTH

  • Up to 50,000 metres of drilling in 2020
  • New resource estimate following drilling
  • Fully funded with +$10 million

GOLD & SILVER

  • Near surface epithermal Au-Ag system
  • Potential link to deeper porphyry system
  • High-grade drill intercepts within a larger bulk tonnage

system

  • 7.0 m at 108 g/t gold & 911 g/t silver*
  • 33.53 m at 5.76 g/t gold & 128.65 g/t silver*
  • Additional discovery targets identified along a 20+ km trend

Investment Opportunity

*Assay interval lengths are core length and are estimated to be 80 to 90% of true width

COMPARABLE EXPLORATION COMPANIES IN CANADA

Apr 07, 2020

Benchmark’s current price provides attractive buying

  • pportunity when compared with

peers

slide-5
SLIDE 5

5

TSX/V : BNCH | OTCQB : CYRTF | WKN : A2JM2X Photovoltaic 8% Other industrial 14% Jewelry 21% Coins and bars 18% Silverware 6% Electronics 24%

>1 B oz

Global Silver Demand 2018

Why Invest in Gold & Silver

10 Reasons to invest in gold

Deflation Geopolitical Uncertainty Risk Management Inflation Hedge History of Maintaining its Value Portfolio Diversification Tangible Asset Increasing Demand Currency Hedge Price Appreciation Source GFMS, Thomas Reuters, Silver institute

NOT JUST PRECIOUS, BUT USEFUL

slide-6
SLIDE 6

6

TSX/V : BNCH | OTCQB : CYRTF | WKN : A2JM2X

Why Invest in Benchmark ?

THE WORLDS LARGEST HEDGE FUND SEES GOLD RISING 30% TO US$2000

$0 $2 $4 $6 $8 $10 SHARE PRICE Discovery Speculation 1-2 years Development Investment Analysis 2-3 years Production Revaluation 2-3 years

Confirmed Deposit Becomes Tier 2 Company Reality Sets In Production Decision Start Up Becomes Tier 1 Company

BENCHMARK POSITIONED FOR GROWTH

MARKET CAP MANAGEMENT MONEY MINERALS MINE LIFE CYCLE

5 M’S

FOR PICKING GOLD MINING STOCKS THE

THE MINE LIFE CYCLE

BENCHMARK

Source: Bridgewater’s co-chief investment officer Greg Jensen

slide-7
SLIDE 7

7

TSX/V : BNCH | OTCQB : CYRTF | WKN : A2JM2X

Why Invest in Benchmark? - Rapidly advancing towards production scenarios

WORLDS LARGEST HEDGE FUND SEES GOLD RISING 30% TO US $2000

2018 2019 2020 2021 2021

Acquired the Project Inaugural Field Program

Drilling provided bulk-tonnage potential and large gold-silver mineralized zones from surface. Eric Sprott becomes major shareholder.

Expansion Drilling

Block modeling of numerous zones. Mineral Inventory Target. Pit shell modeling. 50,000 m expansion and definition drill program. Additional new discovery potential.

Resource Estimate

Targeting multi-million oz potential Advanced work programs to enable Economic & Engineering Studies.

PEA

Results to substantiate a world-class gold- silver asset. Working towards mine development & production scenarios Extensive data compilation and small work program to determine future scope and scale of the project. Source: Bridgewater’s co-chief investment officer Greg Jensen

slide-8
SLIDE 8

8

TSX/V : BNCH | OTCQB : CYRTF | WKN : A2JM2X

Currentshares outstanding& Market Cap @ $0.25 112.8 M $28.20 M Working Capital $10.20 M In the money Warrants 5.9 M $1.32 M In the money Options 1.8 M $0.31 M In the money Diluted Working C apital $11.83 M In the money Diluted Shares & Market Cap @ $0.25 120.5 M $30.13 M Fully diluted Working Capital $19.74 M Fully Diluted Shares and Market Cap @ $0.25 141.0 M $35.25 M

Resurgence in Precious Metals sector

SHARE STRUCTURE Mar 31, 2020 Start of a new bull market Growing demand for precious metals Increased capital investments

Positive External Drivers

Land acquisitions Resource expansion Gold & Silver drill results New discoveries

Internal Drivers

Corporate Snapshot

SHARE PRICE – TSX.V: BNCH

slide-9
SLIDE 9

9

TSX/V : BNCH | OTCQB : CYRTF | WKN : A2JM2X

Joh John Will illia iamson, P.Ge Geol – CE CEO & Ch Chair irman

+30 years mining sector, founder of more than 20 successful companies in Canada and around the globe

Ji Jim Gr Greig ig, , MBA – Pres esident & Di Director

+20 years mining sector, formerly Keegan Resources Ltd, exploration to production expertise

Sea Sean Mager – CF CFO & Dir Director

+20 years mining sector, former CFO & COO at Brilliant Resources Ltd., regulatory & financial expertise

Jer Jeremy Yase aseniu iuk – Cor Corporate De Develo lopment

+20 years in financial markets, Director at Altiplano Minerals Ltd, marketing & financial expertise

Tob

  • by Pi

Pierce, MBA – Di Director

+20 years senior executive with public resource companies, former Banker at GMP Securities London

Mic ichael l Du Dufresne, M.S .SC. C., P.Geol., , P.Ge Geo. . – Di Director

  • r &

& Qu Qualif ifie ied Per erson

+30 years mining sector, professional geologist at world-class mining projects and jurisdictions

Ewan Webster, Ph. Ph.D., ., P.Ge Geo. . – Sen Senior Geo Geolo logis ist

Exploration geologist with a comprehensive field, technical, and academic background

Management & Directors - World Class Team

Collectively over +150 years of mining experience Management of over 25 public mining companies delivering shareholder value Raised in excess of $400 million towards exploration, development & production projects globally Success through discovery, development and production cycles Management twice won Top- 10 mining company in TSXV 50TM

slide-10
SLIDE 10

10

TSX/V : : BNCH | | OTCQB : C CYRT RTF | | WKN : A2JM2X

The Lawyer’s Project

**Source: Benchmark NI43-101 Report, SEDAR,

Fast Track To Production Historic past producer of 171,000 oz gold & 3.7 million oz silver* Road access with year-round exploration potential 11km from existing & permitted Baker Mill 45km NW of Kemess Gold Copper Mine Proven & profitable mining jurisdiction Existing infrastructure estimated @ $50 million

slide-11
SLIDE 11

11

TSX/V : BNCH | OTCQB : CYRTF | WKN : A2JM2X

Located in British Columbia’s prolific ‘GOLDEN HORSESHOE’

Lawyers project is located within the northeastern region

  • f the prolific metal-endowed Stikine terrane. Magmatic

events in Stikinia during the Late Triassic and Early Jurassic are the driving source for the development of mineralizing porphyry and epithermal systems. On both the east and west sides of the Bowser Basin the same magmatic and mineralizing events are recognized, forming an arch of gold and polymetallic mineralization; known herein as the ‘Golden Horseshoe’ .

slide-12
SLIDE 12

12

TSX/V : BNCH | OTCQB : CYRTF | WKN : A2JM2X

The Geological Model – Low Sulphidation Epithermal System

Stratigraphy

The Lawyers property is predominantly underlain by a shallow northwest- dipping sequence of volcanic and sedimentary rocks of the Lower Jurassic Toodoggone Formation.

Structure

NW-NNW trending fault and fracture system that acted as conduits for fluids to migrate and precipitate metals.

Alteration

With proximity to mineralized zones, a range of different alteration assemblages are recognized:

  • Propylitic, Hematite, Argillic, Phyllic (QSP), Silicic, Potassic

Mineralization

Mineralization occurs in two discrete styles: 1. Broad zones of multiphase hydrothermal breccias with mineralized veins that contain abundant fine to -medium grained sulphides and native gold, silver, and electrum. 2. Discrete quartz veins measuring approximately 1-4 metres wide that contain semi-massive sulphides, including acanthite, sulfosalts, chalcopyrite, pyrite and native silver.

Generalized cross section of the Toodoggone district

slide-13
SLIDE 13

13

TSX/V : BNCH | OTCQB : CYRTF | WKN : A2JM2X

90% of the 140 km2 property is underexplored

  • Five resource expansion zones
  • Two new discovery zones for 2020 drill testing
  • Six early stage exploration targets for new discoveries

Previous mining overlooked the bulk-tonnage and porphyry potential

  • High-grade drill intercepts within wider mineralized envelopes
  • Open at depth - average drill hole under 100m
  • Copper porphyry targets associated with large zones of clay alteration,

soil and radiometric anomalies, and key stratigraphic horizons

Large Resource Expansion Areas with New Discovery Potential

Gold-Silver Zones Over Radiometric Geophysics

5 Million oz Gold-Silver Exploration Target

High Grade Drill Results*

3.00m at 259 g/t gold & 3,320 g/t silver – AGB 3.05m at 52 g/t gold & 846 g/t silver – Dukes 2.40m at 87 g/t gold & 2,407 g/t silver – Cliffs 0.90m at 132.5 g/t gold & 8,560 g/t silver - Phoenix

Bulk-Tonnage Drill Results*

25.00m at 2.79 g/t gold & 177 g/t silver – AGB 33.53m at 5.76 g/t gold & 128.65 g/t silver – Dukes 36.50m at 2.68 g/t gold & 82.57 g/t silver – Cliffs 26.00m at 2.42 g/t gold & 100.26 g/t silver - Phoenix

slide-14
SLIDE 14

14

TSX/V : BNCH | OTCQB : CYRTF | WKN : A2JM2X

Cliff Creek Zone - Discovery & Growth

The Cliff Creek Zone extends for over 1.2 km along strike and 250 metres vertical depth and remains open Broad parallel zones of bulk-tonnage mineralization and high-grade mineralization hosted in the hanging-wall

  • f steeply northwest dipping faults

New zones are being discovered within 50 metres of historical underground workings and drilling Drilling highlights:

  • 2.68 g/t Au, 82.57 g/t Ag or 3.71 g/t AuEq across

36.50 metres core length

  • 87.00 g/t Au, 2407.0 g/t Ag or 117.01 g/t AuEq across

2.4 metres core length

*Drill core-lengths

WSW ENE

**

NEW PARALLEL ZONE DISCOVERED

19CCDD025: 36.3 m @ 3.19 g/t AuEq

  • Incl. 3.23 m @ 18.24 g/t AuEq

POTENTIAL FOR NEW DISCOVERIES 50M FROM MAIN ZONE & ONLY JUST DISCOVERED OPEN AT DEPTH

Historical drilling not fully sampled. Multiple parallel zones projected along strike.

slide-15
SLIDE 15

15

TSX/V : BNCH | OTCQB : CYRTF | WKN : A2JM2X

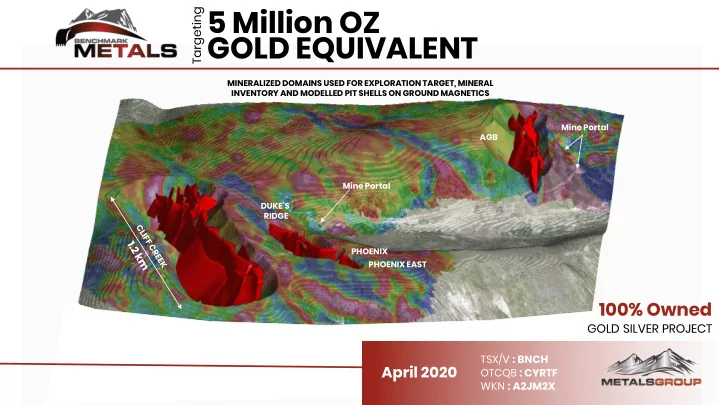
Cliff Creek Zone Exploration Target

Cliff Creek bulk tonnage Exploration Target ranges from 30.6 million tonnes to 34.7 million tonnes with a range in grades of 1.71 g/t AuEq to 1.73 g/t AuEq at a lower cutoff of 0.5 g/t Au, yielding an estimated range of 1,682,000 AuEq

  • unces to 1,924,000 AuEq ounces.*

86% of the AuEq ounces are within 300m of surface. Cliff Creek remains remain open in all directions. AGB, Duke’s Ridge, Phoenix, and Phoenix East zones have similar resource potential. BLOCK MODEL

Pit shell model

*A silver to gold ratio of 80:1 has been used in the calculation of AuEq **Total ounces may not add due to rounding. ***The tonnes, grade and ounces presented are an Exploration Target, and are conceptual in nature, there has been insufficient exploration to define a mineral resource and it is uncertain if further exploration will result in the target being delineated as a mineral resource. The Target has not been evaluated for reasonable prospects for future economic extraction as metallurgical work and drilling are planned and ongoing.

1.92 Moz AuEq EXPLORATION TARGET

(CLIFF CREEK ZONE LONG SECTION) – 1.2 Km

Exploration Target*** – Range of Tonnes and Grades

A full table of results, modeling details, and parameters can be found on the Benchmark Metals website and in the February 28th press release.

AuCutoff Tonnes Avg au g/t au oz Avg ag g/t ag oz Avg EQ Au ppm EQ Au oz

0.2 61,969,042 0.866 1,725,597 25.66 51,124,711 1.154 2,299,767 0.5 34,687,453 1.278 1,425,494 39.791 44,375,916 1.725 1,923,869 2 4,349,789 3.678 514,302 128.402 17,956,826 5.12 715,971 0.2 55,046,348 0.859 1,520,935 25.486 45,104,233 1.146 2,027,490 0.5 30,622,770 1.266 1,246,245 39.451 38,841,095 1.709 1,682,460 2 3,655,852 3.794 445,972 130.289 15,313,962 5.258 617,960

slide-16
SLIDE 16

16

TSX/V : BNCH | OTCQB : CYRTF | WKN : A2JM2X

Multiple Resource Zones for Expansion & Definition

Following the 2019 drilling program Benchmark has defined five discrete mineralized zones that will be the focus of resource definition and expansion drilling in 2020. Up to 50,000 m of expansion and definition drilling will target all of these zones in 2020. A global resource estimate will comprise Cliff Creek, Duke’s Ridge, Phoenix and AGB. Six additional exploration targets across the 140 km2 property could provide additional ounces.

PHOENIX EAST PHOENIX DUKE’S RIDGE AGB

MINERALIZED DOMAINS USED FOR EXPLORATION TARGET, MINERAL INVENTORY AND MODELLED PIT SHELLS ON GROUND MAGNETICS

Mine Portal

slide-17
SLIDE 17

17

TSX/V : BNCH | OTCQB : CYRTF | WKN : A2JM2X

Q4 2020 Q1 2021

2020

Q2 2020 Q3 2020

2020 CORPORATE OBJECTIVES

*Quarters are calendar year

Geological interpretation. Advanced metallurgical, permitting, and environmental studies. Commence drill and field exploration

  • programs. Geotechnical

& Engineering studies. 50,000m drill program, metallurgy, infrastructure improvements. Interpretation and 43- 101 resource estimation.

2021

Q2 2021

Commence PEA. Geology and Engineering programs to support future feasibility study.

slide-18
SLIDE 18

18

TSX/V : BNCH | OTCQB : CYRTF | WKN : A2JM2X

Canadian Development and Mining Projects*

Company Project Resource Annual Production Economics CAPEX Market Cap Marathon Gold Valentine Lake Gold Newfoundland Canada M+I 3.09 Moz @1.75 g/t Au 175,000 oz per annum 12 year LOM IRR = 36 % NPV = C$ 472 M @ US$ 1350 Au (both after tax) (PFS 2020)1 C$ 272 M C$ 261.5 M Spanish Mountain Gold Spanish Mountain Gold British Columbia Canada M+I 4.1 Moz @ 0.47 g/t Au 104,000 oz per annum 11 years LOM IRR = 21 % NPV = C$ 325 M @ US$ 1275 Au (both after tax) (PEA 2019)2 C$ 364 M C$ 22.67 M Atlantic Gold (St Barbera Mines) Moose River Gold Nova Scotia Canada In-production M+I 1.87 Moz @ 1.12 g/t Au 87,000 oz per annum 8+ years LOM IRR = 30 % NPV = C$ 168 M @ US$ 1200 Au (both after tax) (FS 2015)3 C$ 137 M C$ 802 M acquisition in 2019 including Touquoy + Moose River Premier Gold Mines & Centerra Gold Mines Hard Rock Gold Ontario Canada M+I 7.11 Moz @ 1.50 g/t Au (2019 update)4 288,000 oz per annum 14.5 years LOM IRR = 14.4 % NPV = C$ 709 M @ US$ 1250 Au (both after tax) (FS 2016)5 C$ 1250 M N/A

1https://www.marathon-gold.com/site/assets/files/5153/4-6 2020_marathon_announces_valentine_pfs.pdf 2https://www.spanishmountaingold.com/project/phase-1-economics/ 3https://www.globenewswire.com/news-release/2015/07/02/997350/0/en/Atlantic-Gold-Confirms-Economics-of-the-MRC-Project-in-Nova-Scota-in-Feasibility-Study-With-After-Tax-NPV-of-168-Million-and-After-Tax-IRR-of-30.html 4https://www.premiergoldmines.com/updated-resource-estim 5https://www.premiergoldmines.com/centerra-gold-and-premier-gold-announce-feasibility-study-results-on-the-hardrock-project

*Benchmark personnel have not visited the mentioned projects. Benchmark is neither implying that there is any correlation between the geology and styles of mineralization of these projects nor any inference of economics and/or scale to the Lawyers project.

slide-19
SLIDE 19

19

TSX/V : BNCH | OTCQB : CYRTF | WKN : A2JM2X

TRACK RECORD AND TEAM

  • Experienced team with decades of mining

experience

  • One of the Metals Group of Companies

OPPORTUNITY

  • 100% ownership of Lawyer’s gold and silver project
  • Located in an area of proven prolific mineralization
  • 140 km2 land package is 90% underexplored
  • Access to existing mining infrastructure
  • Mining-friendly, low-risk jurisdiction
  • Fully funded, +$10M in working capital
  • Near term resource estimate

NEAR-TERM OBJECTIVES

  • Up to 50,000m drill program focused on expansion and

definition drilling resource

  • Drill testing geophysical and geochemical targets for

new discoveries

  • Expanded metallurgical test program investigating the

mineralization for potential bulk-tonnage mining.

  • Geotechnical program to potentially minimize open pit

strip ratios

  • Develop additional Au-Ag and Cu-Au exploration

targets

  • New Resource Estimate following drill results

Value Proposition

LONGER-TERM OBJECTIVES

  • PEA (Preliminary Economic Assessment)
  • FS (Feasibility Study)
  • Re-establish future mining
slide-20
SLIDE 20

20 JeremyYaseniuk Corporate Development

jeremyy@bnchmetals.com 1.604.773.1467

JimGreig President

jimg@bnchmetals.com 1.604.260.6977

John Williamson Chairman & CEO

johnw@bnchmetals.com

Head Office

10545 45 Avenue NW 250 Southridge, Suite 300 Edmonton, Alberta Canada www.benchmarkmetals.com

TSX/V : BNCH | OTCQB : CYRTF | WKN : A2JM2X

Contact