5/31/2019 Acknowledgements 1 2 Study co-investigators Funding - - PDF document

5 31 2019
SMART_READER_LITE
LIVE PREVIEW

5/31/2019 Acknowledgements 1 2 Study co-investigators Funding - - PDF document

5/31/2019 Acknowledgements 1 2 Study co-investigators Funding source Jessica Lavery, MS Cancer Center Support Grant [P30 CA 008748] Peter Bach, MD, MAPP to Memorial Sloan Kettering Cancer Center Diane Li, BA Variation in 30-day mortality


slide-1
SLIDE 1

5/31/2019 Allison Lipitz-Snyderman 1

1

Variation in 30-day mortality following cancer surgeries across U.S. hospitals

Allison Lipitz-Snyderman, PhD Assistant Attending, Center for Health Policy and Outcomes Department of Epidemiology and Biostatistics Memorial Sloan Kettering Cancer Center June 4, 2019

2

Study co-investigators Jessica Lavery, MS Peter Bach, MD, MAPP Diane Li, BA Ashley Russo, MD Vivian Strong, MD Katherine Panageas, DrPH Funding source Cancer Center Support Grant [P30 CA 008748] to Memorial Sloan Kettering Cancer Center Disclosures: None.

Acknowledgements

3

Background

  • Quality measurement and public reporting are common

strategies to motivate improvement and provide comparative information to the public.

  • Cancer surgeries are largely left out of large-scale public

reporting efforts.

  • Decades of research show a volume-outcome relationship.
  • Patients want comparative performance data on cancer

surgical outcomes, but publicly available information across the U.S. is limited.

4

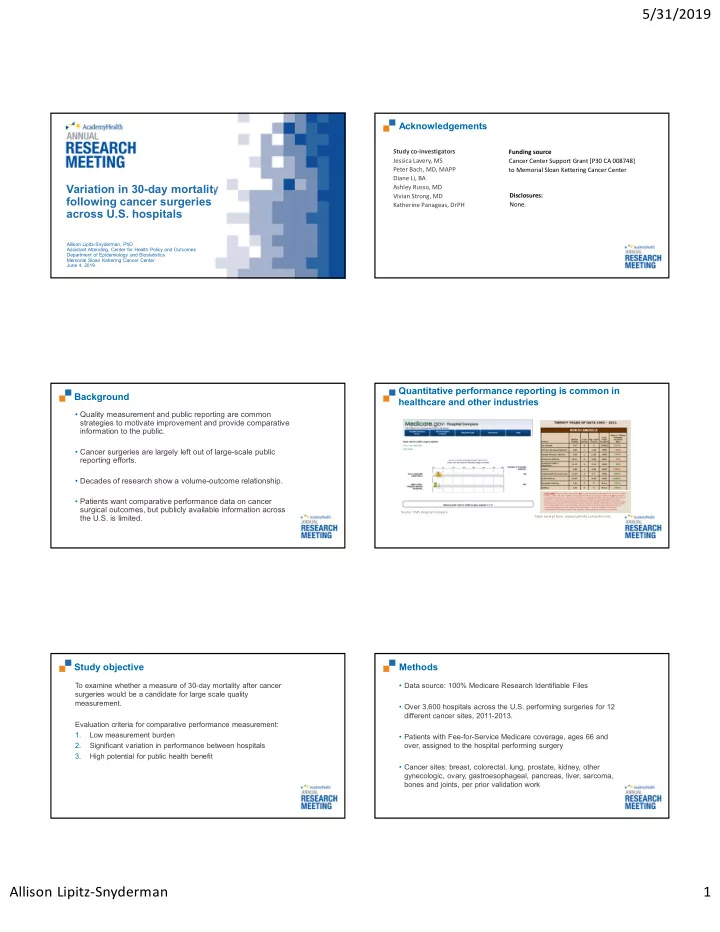
Quantitative performance reporting is common in healthcare and other industries

Table excerpt from: planecrashinfo.com/rates.htm Source: CMS Hospital Compare 5

Study objective

To examine whether a measure of 30-day mortality after cancer surgeries would be a candidate for large scale quality measurement. Evaluation criteria for comparative performance measurement: 1. Low measurement burden 2. Significant variation in performance between hospitals 3. High potential for public health benefit

6

Methods

  • Data source: 100% Medicare Research Identifiable Files
  • Over 3,600 hospitals across the U.S. performing surgeries for 12

different cancer sites, 2011-2013.

  • Patients with Fee-for-Service Medicare coverage, ages 66 and
  • ver, assigned to the hospital performing surgery
  • Cancer sites: breast, colorectal, lung, prostate, kidney, other

gynecologic, ovary, gastroesophageal, pancreas, liver, sarcoma, bones and joints, per prior validation work

slide-2
SLIDE 2

5/31/2019 Allison Lipitz-Snyderman 2

7

Analysis

  • Performance metric: 30-day mortality after cancer surgery
  • Linear mixed effects model to obtain an estimate of each

hospitals’ risk adjusted mortality rate.

  • Adjusted for patients’ age, sex, race, Charlson comorbidities,

emergent surgery; hospitals’ ownership, rural location, teaching status

  • Examined the extent of variation between hospitals overall and

by cancer site using Wald test of the random effect.

8

Number of surgeries and hospitals performing surgeries for Fee-for-service Medicare patients, 2011-2013

  • No. of surgeries
  • No. hospitals

performing surgery Median no. surgeries per hospital (IQR) Overall 340,489 3,776 34 (9, 108) Breast 119,217 3,537 17 (5, 44) Colorectal 85,857 3,471 14 (5, 34) Lung 33,513 1,844 9 (3, 23) Prostate 29,207 1,600 7 (<3, 21) Kidney 24,578 1,998 6 (<3, 15) Other gynecologic 18,603 1,615 3 (<3, 12) Ovary 8,805 1,137 3 (<3, 10) Gastroesophageal 7,899 1,512 <3 (<3, 5) Pancreas 6,391 785 3 (<3, 8) Liver 3,562 556 3 (<3, 7) Sarcoma 1,984 506 <3 (<3, 4) Bones and Joints 873 302 <3 (<3, 3)

Unpublished data 9

Overall 2 Cancer Site Examples Column (%) Colorectal Gastroesophageal

  • No. of surgeries

340,489 85,857 7,899 Age (years) 66-69 22% 14% 20% 70-74 28% 22% 30% 75-79 22% 22% 25% 80-84 16% 21% 16% 85+ 12% 21% 10% Female (%) 67% 54% 35% White (%) 89% 88% 80%

  • No. comorbidities

45% 39% 33% 1 27% 26% 29% 2+ 29% 35% 39%

Characteristics of surgeries for Fee-for-service Medicare patients, 2011-2013

Unpublished data 10

Characteristics of hospitals performing surgeries for Fee-for-service Medicare patients, 2011-2013

Overall 2 Cancer Site Examples Column (%) Colorectal Gastroesophageal

  • No. of hospitals

3,776 3,471 1,512 Teaching (%) 93% 93% 85% Ownership Not-for-profit 63% 65% 70% Private 19% 19% 18% Government 18% 17% 12% Rural (%) 36% 34% 12%

Unpublished data 11

Hospital median risk-standardized 30-day mortality ratio (IQR) Test of variation Overall 2.41 (2.31, 2.58) <.001 Breast 0.23 (0.22, 0.24) <.001 Colorectal 5.07 (4.85, 5.47) <.001 Gastroesophageal 5.81 (5.69, 5.88) 0.080 Kidney 1.55 (1.50, 1.58) 0.036 Liver 4.19 (4.06, 4.26) 0.023 Lung 4.76 (4.54, 5.24) <.001 Other gynecologic 1.41 (1.38, 1.41) 0.102 Ovary 3.43 (3.28, 3.48) 0.009 Pancreas 4.23 (4.05, 4.40) 0.030 *Bones and joints, prostate, and sarcoma are included in aggregate analysis but results by cancer site are not estimable.

Hospitals’ median risk-standardized 30-day mortality ratio and test of between-hospital variation

Overall estimated 600 deaths prevented if hospitals in the worse performing quintile improved to the median.

Unpublished data 12

Potential limitations

  • May be unaccounted for factors that could contribute to

differences between hospitals.

  • Prior validation work on cancer stage.
  • Unknown generalizability outside the Fee-for-Service Medicare

program.

  • Comprehensive evaluation of cancer surgical quality.
slide-3
SLIDE 3

5/31/2019 Allison Lipitz-Snyderman 3

13

Conclusions and Implications

  • Support for low burden measurement, variation between

hospitals, and public health benefit.

  • There are some tradeoffs to consider.
  • Low burden source, but time delay.
  • Low numbers of surgeries for many hospitals, but could impact the

reliability of adjusted estimates

  • 30-day mortality after cancer surgeries is an untapped potential

metric for large-scale comparative performance measurement.

14

Members of the public and

  • ther stakeholders should not

assume that all hospitals have equal outcomes of cancer surgery.

*Photographs by Allison Lipitz-Snyderman, New Jersey Transit train / train station

15

Questions / comments?

Contact information: Allison Lipitz-Snyderman, PhD Center for Health Policy and Outcomes Department of Epidemiology and Biostatistics Memorial Sloan Kettering Cancer Center E-mail: snyderma@mskcc.org