
SLIDE 1
4/19/2016 1
Chapter 6 Inference for categorical data
Huamei Dong 03/17/2016 Last class, we talked about the inference for a single proportion, that is, confidence interval and hypothesis test about one proportion. Today we will learn the inference for the difference of two proportions.
1. Quick Review 2. Sampling distribution of differences of two proportions 3. Confidence interval for p1-p2 4. Hypothesis test when H0: p1=p2
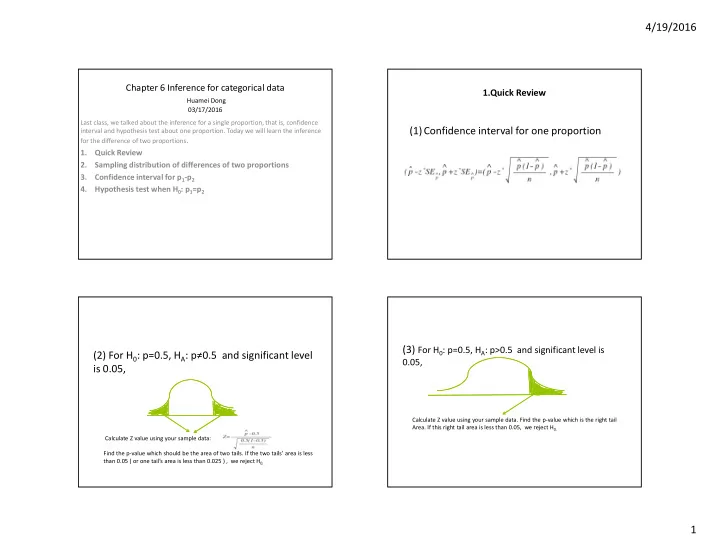
1.Quick Review
(1)Confidence interval for one proportion (2) For H0: p=0.5, HA: p≠0.5 and significant level is 0.05,
Calculate Z value using your sample data: Find the p-value which should be the area of two tails. If the two tails’ area is less than 0.05 ( or one tail’s area is less than 0.025 ) , we reject H0.
(3) For H0: p=0.5, HA: p>0.5 and significant level is
0.05,
Calculate Z value using your sample data. Find the p-value which is the right tail
- Area. If this right tail area is less than 0.05, we reject H0.