
SLIDE 1
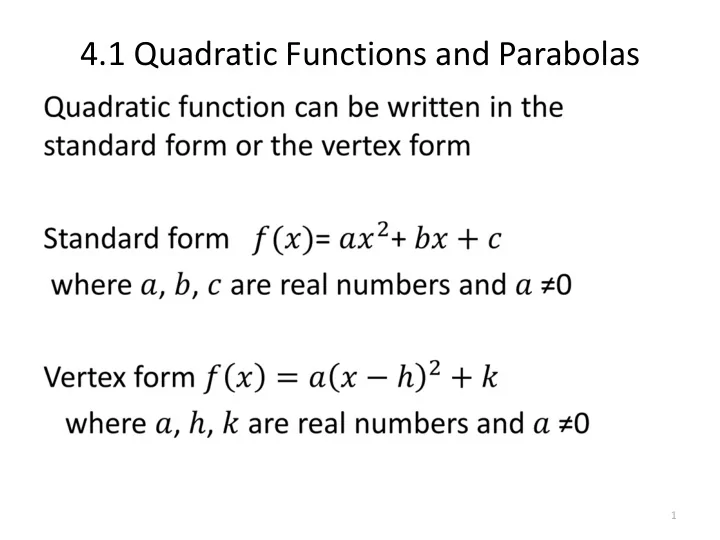
4.1 Quadratic Functions and Parabolas
1
4.1 Quadratic Functions and Parabolas 1 4.1 Continued 2 Use the - - PowerPoint PPT Presentation
4.1 Quadratic Functions and Parabolas 1 4.1 Continued 2 Use the graph of f ( x ) to estimate the following: a. For what x values is this curve increasing? Decreasing? Write your answer using inequalities. b. Vertex c. x -intercept(s) Back
1
2
4.1-1 Back to Table of Contents
4.1-1
Back to Table of Contents
4.7-1 Back to Table of Contents
4.2-1
Back to Table of Contents
4.2-2
Back to Table of Contents
4.7-1
2
Back to Table of Contents
4.7-1 Back to Table of Contents
4.7-1 Back to Table of Contents