SLIDE 1
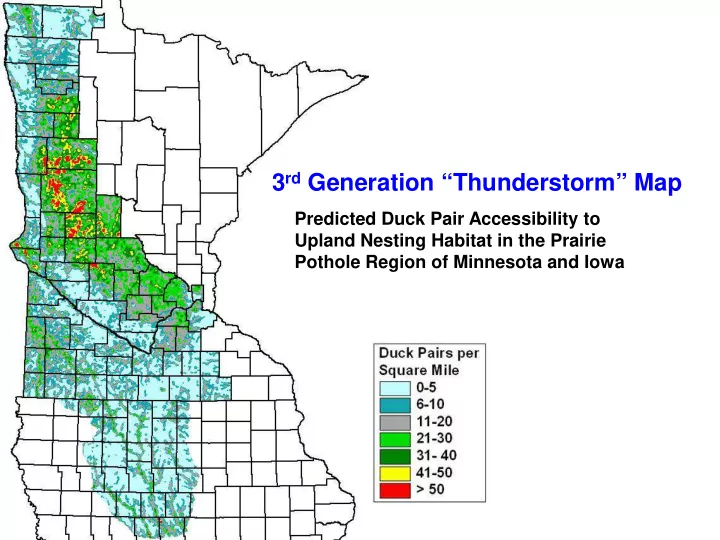
Predicted Duck Pair Accessibility to Upland Nesting Habitat in the Prairie Pothole Region of Minnesota and Iowa
3rd Generation “Thunderstorm” Map
SLIDE 2
Grassland Bird Conservation Areas
SLIDE 3 Wetland Reserve Program rankings for the MN River watershed (20 = highest) Developed to identify wetland and grassland restoration priorities, based on a compilation of:
- 5 waterfowl species
- 9 shorebird species
- 9 grassland bird species
- 1 waterbird species
SLIDE 4 Status of the Restorable Wetlands Inventory
Mapping Completed 2001 - 2008
32,500 mi² Goals ls f for Inv Invent ntory Analyzed Area: Counties: 47 Co Comp mpleted t to Date Analyzed Area: 28,020 mi² Funded Work Area: 6,570 mi²
Completed In Progress
LCCMR has provided nearly $500,000 over last 2 years
SLIDE 5
SLIDE 6
MN DNR-delineated “Lakeshed” – Darker blues indicate more water accumulations at that point (flow accumulation grid)
SLIDE 7
To create flow accumulation grids, you must first use a topographic model of land surface and map surface run off pathways (generally also followed by tiles and ditches
SLIDE 8
Continue to make flow paths more and more refined
SLIDE 9
Until flow paths indicate where every 2 acres of the lakeshed sends its runoff
SLIDE 10
Flow networks created from flow accumulation grid with NWI wetlands (blue) and restorable wetlands (gray)
SLIDE 11
SLIDE 12
SLIDE 13
– Riverine – Riparian areas – Seasonal wetlands – Semipermanent wetlands – Forested/Shrub Scrub wetlands – Woodlands
Raccoon Homeranges Females ~4 sq. miles Males ~9 sq. miles
Based on information compiled in Predation Management Review.
SLIDE 14
Landscapes for Upland Sandpiper, Hudsonian Godwit, Dunlin, and White-rumped Sandpiper during Spring Migration
Average slope Percent grass Percent palustrine (ln) Proportion of temporary and seasonal
SLIDE 15 Predicted pairs/40 ac for 6 species (combined)
Additional models:
- CCSP
- WEME probability of use
SLIDE 16
With CRP Without CRP % lo loss Grass >1 ha 863,263 711,846 17. 17.5 Bobolink 888,863 626,152 29. 29.6 Clay-colored Sparrow 247,717 153,462 38. 38.1 Grasshopper Sparrow 198,298 128,308 35. 35.3 Savannah Sparrow 559,044 366,324 34. 34.5 Sedge Wren 730,540 502,674 31. 31.2 Le Conte’s Sparrow 261,169 123,973 52. 52.5
CRP and Grassland Birds
SLIDE 17 Core Areas:
- Large 5,000 to 300,000 acre landscapes (36 in total) that retain some features
- f a functioning prairie landscape and include 73% of Minnesota's remaining
native prairie
- Function as a habitat base for wildlife species needing large areas of natural
habitat
- Goal: reach 40% grassland and 20% wetland coverage within each Core Area
Corridors:
- Linear stretches of habitat 6 miles wide that connect Core Areas to each other
and moderate the effects of a highly fragmented landscape
- Function as dispersal corridors that allow an exchange of individuals and
genetics between populations
- Goal: 10% of each square mile in the Corridor be protected grassland and
wetland habitat
Corridor Complexes:
- 9 square mile habitat complexes established every 6 miles within the Corridors
- Function as habitat "stepping stones" for mobile wildlife species within the
Corridors
- Goal: reach 40% grassland and 20% wetland within each Corridor Complex
Agricultural Matrix:
- All the remaining area of the Prairie Region outside of Core Areas, Corridors,
and Corridor Complexes (21.7 Million Acres)
- Function as habitat for species adapted to live within an agricultural
countryside
- Goal: reach 10% perennial native perennial cover within each Ecological
Landtype Association
MN Prairie Landscape Conservation Plan
SLIDE 18