
SLIDE 1
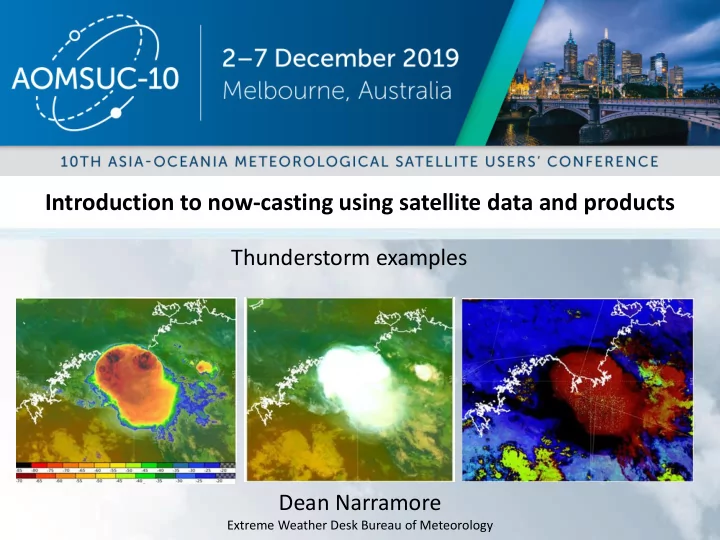
Introduction to now-casting using satellite data and products
Dean Narramore
Extreme Weather Desk Bureau of Meteorology
Introduction to now-casting using satellite data and products - - PowerPoint PPT Presentation
Introduction to now-casting using satellite data and products Thunderstorm examples Dean Narramore Extreme Weather Desk Bureau of Meteorology Content Satellite products for monitoring convection. What do you use? How useful is satellite
Extreme Weather Desk Bureau of Meteorology
you use?
thunderstorm development?
thunderstorms and where they might form.
satellite data?
Broadscale setting – Airmass RGB Overview: Visible / Enhanced IR / Sandwich Sandwich product Day Convective RGB
Images courtesy BOM/JMA
Alerting (machine learning) algorithms (COTAC) Monitoring tool (IR-WV) Severe Storm Algorithms
(situation at 1930UTC, 14th December) Enhanced IR (Tropical) Night Micro RGB (Midlat) Night Micro RGB (Tropical) Airmass RGB (Tropical) Airmass RGB Airmass RGB and enhanced IR
images courtesy JMA/BOM
Darwin
(situation at 1930UTC)
Enhanced IR (Tropical) Night Micro RGB (Midlat) Night Micro RGB (Tropical) Airmass RGB (Tropical) Airmass RGB Airmass RGB and enhanced IR
Stormtops best defined
images courtesy JMA/BOM
Colour interpretation palette
images courtesy JMA / Eumetsat
Himawari-8 channels
CHANNEL COMBINATION (BOM/JMA recipe)
Airmass RGB Range Gamma
6.2 – 7.3 micron
1.0 9.6 - 10.4 micron
1.0 6.2 micron 243.9 to 208.5 1.0
Himawari-8 RGB Composite
Kimberley thunderstorms of 4th November 2019, 03 to 09UTC
Satellite image animations courtesy JMA/BOM, Lightning data courtesy WeatherZone
Please start the Power Point Slide Show to activate the animation
Sandwich Product (Vis and IR) Visible channel and RADAR Sandwich Product and Lightning
Light Heavy pptn IR10.4 BT HR Vis
4th November 2019,
Satellite image animations courtesy JMA/BOM, Lightning data courtesy WeatherZone
Sandwich Product (Vis and IR) Visible channel and RADAR Sandwich Product and Lightning
Light Heavy pptn IR10.4 BT HR Vis
4th November 2019,
Satellite image animations courtesy JMA/BOM, Lightning data courtesy WeatherZone
Sandwich Product (Vis and IR) Visible channel and RADAR Sandwich Product and Lightning
Light Heavy pptn IR10.4 BT HR Vis
4th November 2019,
Satellite image animations courtesy JMA/BOM, Lightning data courtesy WeatherZone
Sandwich Product (Vis and IR) Visible channel and RADAR Sandwich Product and Lightning
Light Heavy pptn IR10.4 BT HR Vis
10 FPS Rocking animations of storms developing over the northwest Top End, Australia 0400 to 0820UTC 6th December 2018 using the RAMMB/CIRA SLIDER functionality
Please start the Power Point Slide Show to activate the animation
Storm relative motion Earth relative motion
Roma
satellite animations courtesy JMA / CIRA RAMMB
Darwin
10 FPS Rocking animations of storms developing over the northwest Top End, Australia 0400 to 0820UTC 6th December 2018 using the RAMMB/CIRA SLIDER functionality
satellite animations courtesy JMA / CIRA RAMMB
Storm propagating into a local convergence area, (a line of Cu)
Darwin 0550UTC 0700UTC 0820UTC
Storm propagating along the seabreeze front boundary Storm propagating into a local convergence area, (a line of Cu) Storms weakening as they encounter the seabreeze boundary
Enhanced Infrared / Sandwich product and 10 minute lightning data 12UTC 14th December to 11UTC 15th December
Darwin Timor Broome
Please start the Power Point Slide Show to activate the animation
animations courtesy JMA/BOM, lightning data from WeatherZone
(trial of the animations from 15 to 20UTC)
Darwin
Bottom layer (“background”): Airmass RGB (midlat tuned) Mid layer: IR10.4 BT midlat scale Blending options – applied to the upper layer
satellite images courtesy JMA/BOM
Modification by BOM staff, including Operational Forecasters and B.Zeschke Upper and mid layer opacity set to 50%
scale as adapted from Australian Bureau of Meteorology forecasters
Top layer: IR10.4 BT tropical scale
Before After
images courtesy JMA/BOM
Pancake formation Overshooting top Gravity waves Radial cirrus Ship wake Cold ring shaped storm Cold U-shaped storm Jumping cirrus Above anvil cirrus plume
Please start the Power Point Slide Show to activate the animation
Comparing RADAR, Himawari-8 satellite and lightning data.
RADAR animation data courtesy NEA Singapore satellite animations courtesy BOM/JMA, lightning data from Weather Zone
Modified Tropical Sandwich Product
(vis brightness -170, contrast 400)
Tropical Sandwich Product
Singapore
at the time 16:20 LST, 0810UTC Comparing RADAR, Himawari-8 satellite and lightning data.
RADAR data courtesy NEA Singapore
Modified Tropical Sandwich Product
(vis brightness -170, contrast 400)
Tropical Sandwich Product
20km
satellite data courtesy BOM/JMA, lightning data from Weather Zone
th Ju
at the time 16:20 LST, 0820UTC Comparing RADAR, Himawari-8 satellite and lightning data.
RADAR and precipitation data courtesy NEA Singapore
Modified Tropical Sandwich Product
(vis brightness -170, contrast 400)
Tropical Sandwich Product
20km
satellite data courtesy BOM/JMA, lightning data from Weather Zone
24 hour precipitation (mm)
from http://www- das.uwyo.edu/~geerts/cwx/notes/chap02/parallax.html
Singapore location 1.35° N, 103.82° E Himawari-8 sub-satellite 0, 140.7E Distance from sub- satellite point ~37 degrees Normalise cloud offset ~ 0.8 to 0.9 Stormtop height ~14km (Tbb ~-65C) Offset ~12 km away from (to
west) of sub-satellite point image from University of Wyoming image modified from Satellite Liaison Blog submission by B.Line
Dean Narramore Extreme Weather Desk Bureau of Meteorology Australia